Select units of measurement for the temperature and rainfall tables (metric or imperial).
Average weather, temperature, rainfall, sunshine
In Portugal, the climate is
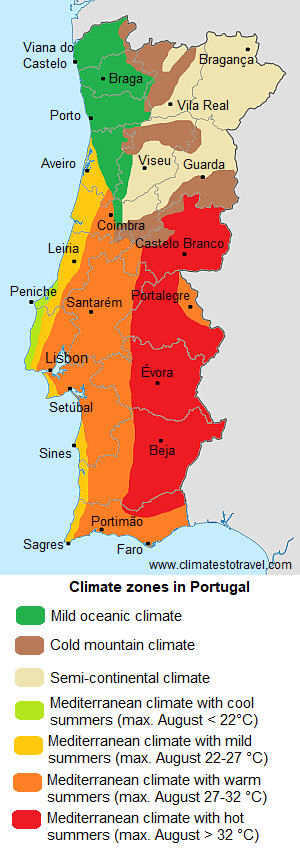
subtropical oceanic in the northwest, with mild, rainy winters and warm, sunny summers, while in the northeast, occupied by hills, the climate is
semi-continental, with quite cold winters, and warm to hot summers during the day, but with cool nights.
In the center-south, characterized by mild winters, less frequent rains and longer summers, we can speak of
Mediterranean climate, with nuances regarding the rainfall, which progressively decreases as you go south, and the summer temperatures, which are cool in the areas most exposed to the ocean winds, and hot in the interior, towards the border with Spain.
In the north-central, there are also
mountain ranges. In the highest, Serra da Estrela, which reaches 1,993 meters (6,537 feet), you can ski in winter.
In the following map, we can see the
climate zones in Portugal.
 Rainfall
 is more frequent and abundant in the north, and gradually less frequent as you go south. In fact, annual precipitation amounts to 1,450 mm (57 inches) in
Braga and 1,250 millimeters (49 in) in Porto, while it drops to around 900 mm (35 in) in
Coimbra, to 800 mm (31.5 in) in Lisbon, and to about 500 mm (20 in) in Algarve.
Therefore, the landscape in the north is definitely green, while it gradually becomes more arid towards the south, down to Algarve, which has a fairly dry climate.
Portugal is a country in southwestern Europe bordering the Atlantic Ocean.
The climate in detail
The seasons
Winter, from December to February, is mild on the coast, even in the northern part, since the average temperature in January is around 10 °C (50 °F) in Porto, 12 °C (53.5 °F) in Lisbon, and 12.5 °C (54.5 °F) in Faro.
In winter, there are
periods of good weather when the Azores Anticyclone settles in the country. However, there are also
waves of bad weather, with rain and wind. Sometimes, gale force winds may blow from the ocean, especially in the north.
The position of the country, overlooking the ocean and on the periphery of Europe, provides good shelter from
cold currents. Indeed, night frosts are very rare and not intense, especially on the coast, where the records are a few degrees below freezing in the north and around 0 °C (32 °F) in the south.
On the other hand, in the inland areas of the center-north, winter is colder, especially in hilly and mountainous areas, where it can sometimes even snow.
Summer, from June to mid-September, is sunny because Portugal in this season is protected by the Azores High, however, a few weather fronts can still affect the northern part of the country.
The summer is very mild or pleasantly warm on the north coast, and warm to hot in the center and south. In Porto, the daily average temperatures in August is 20 °C (68 °F), with highs around 25 °C (77 °F). In Lisbon, the average is higher, and reaches 23.5 °C (74.5 °F), with highs around 28 °C (82 °F). However, in the coastal areas most exposed to ocean winds, which usually blow from the northwest (see
Peniche, Cabo da Roca), it is cool even in summer. The Algarve coast is more sheltered, and therefore the temperatures are similar to those of Lisbon.
The heat is
more intense in the interior, especially in the south-central, in the plains and in valleys at low altitudes (see Évora, Beja), where sometimes it can be scorching.
However, from mid-June to early September, the whole of Portugal can be hit by
heat waves from Africa. In these situations, the temperature can exceed 36/37 °C (97/99 °F) on the coasts, while it can exceed 40 °C (104 °F) in inland areas.
Spring and autumn are cool in the north and mild in the south. The rains are quite frequent, especially in the north, where it can sometimes be a bit cold.
North
Porto
In
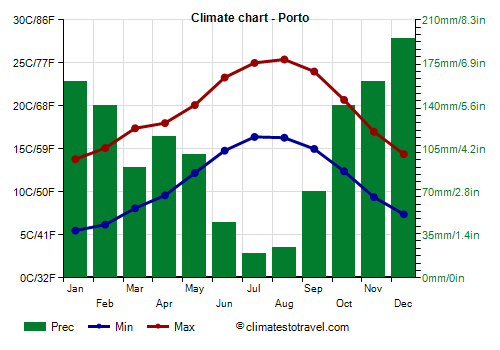
Porto, located in the northern part of the coast, the average temperature ranges from 10 °C (50 °F) in January to 20 °C (68 °F) in August.
The rains are more frequent and abundant from November to February, while they are quite rare in summer.
The temperature of the
sea in the northern part of the coast is very cool, if not cold, even in summer, in fact it reaches 19 °C (66 °F) in August.
In the
inland areas of the north, east of
Aveiro and Oporto, the winter is colder, not only for the greater distance to the sea, but also because the altitude increases, and at times it can snow.
Bragança
In
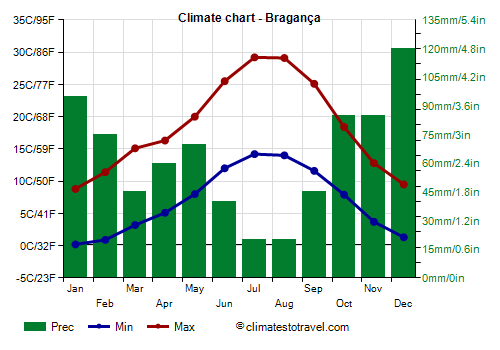
Bragança, located in the extreme north-east, at 700 meters (2,300 feet), near the Montesinho Natural Park, the average in January is 5 °C (41 °F). During the most intense cold periods, the temperature can go down to around -10 °C (14 °F). Summer is hot and sunny, even though nights are cool. Sometimes it can get very hot here as well.
Further south, and north-east of Coimbra, we find a mountain range, the
Serra da Estrela, which reaches 1,993 meters (6,539 ft). Here the temperature can drop to -15/-20 °C (-4/5 °F).
To the north-east of the Serra da Estrela we find Manteigas, at almost 800 meters (2,600 feet), and
Guarda, which is located at 1,000 meters (3,300 feet) above sea level.
Penhas Douradas

In
Penhas Douradas, 1,400 meters (4,600 ft) above sea level and a short distance from Manteigas, the average temperature ranges from 3.5 °C (38 °F) in January to 19 °C (66 °F) in August.
Precipitation exceeds 1,500 mm (59 in) per year.
Center-south
In central and southern Portugal, winter is milder, Atlantic disturbances pass less often over the region, and windy days are less frequent. Summer is warmer, but not on the coast, where the ocean air is felt even in this season.
Lisbon
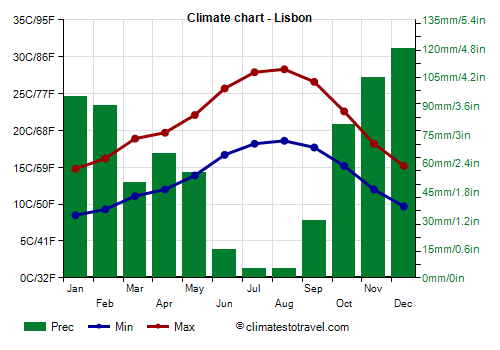 Lisbon
, the capital, is located not exactly on the Atlantic coast, but in a sheltered bay on the estuary of the Tagus river, so in summer it is warm, with highs of 28/28.5 °C (82.5/83 °F) in July and August (while for example, at Cabo da Roca, it is cool even in summer).
The
sun in central and southern Portugal shines regularly in summer, but even in winter there are several sunny periods. In the north, the sun shines a little less often in Porto, on average, about an hour less in both winter and summer.
In Lisbon, the sea temperature is slightly warmer than in Porto, although it's still very cool for swimming, in fact, it only reaches 20.5 °C (69 °F) in July and August.
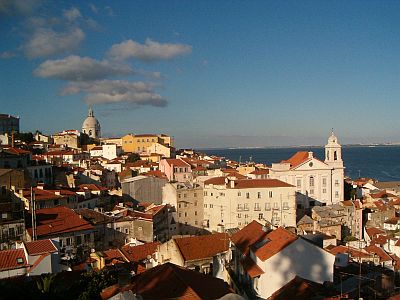
In
inland south-central areas (Alentejo region, see
Évora,
Beja), summer is definitely hot, especially during heat waves from Africa.
Beja
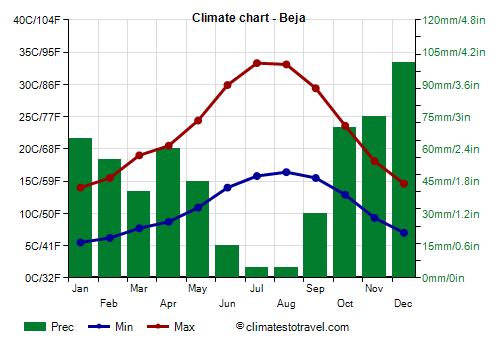
In
Beja, the maximum temperatures in July and August exceed 33 °C (91.5 °F), furthermore, the temperature can reach 45 °C (113 °F) in the worst moments.
In August 2003, in Amareleja, a town located in Alentejo, north-east of Beja, the temperature reached 47.3 °C (117 °F).
Algarve

In the far south, in Algarve, along the south-facing Atlantic coast, in cities such as Lagos, Portimão, Albufeira, Faro, and Tavira, the climate is
Mediterranean, though the summer is not as sultry as in the real Mediterranean areas. The climate here is similar to that of Lisbon but a little less rainy, in fact, the yearly rainfall is around 500 mm (20 in).
Summer is sunny, and there are often lively breezes; in addition, there may be some days a bit cool, with highs below 25 °C (77 °F), especially in June and in the first half of July.
However, the cold records in the Algarve are around 0 °C (32 °F), while the heat records are around 40 °C (104 °F).
Faro
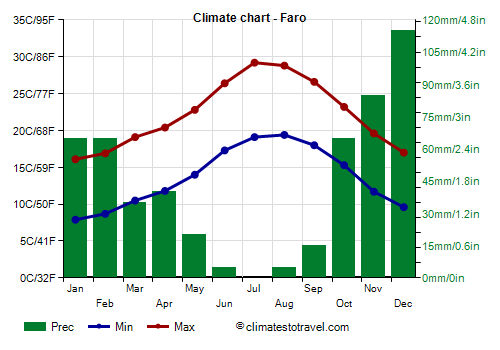
In
Faro, the average temperature ranges from 12.3 °C (54 °F) in January to 24.4 °C (76 °F) in July and August.
The sea on the south coast of Algarve is cool, although a little less than in the rest of Portugal, in fact, it reaches 21.5 °C (71 °F) in August and September.
Sagres
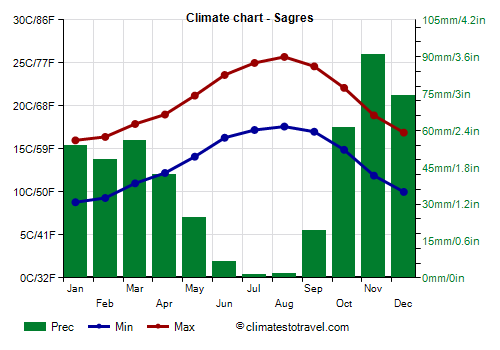
On the
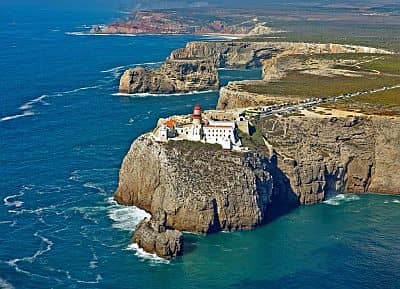
south-western tip, in Cape St. Vincent and in Sagres, the summer is cooler: average highs in July and August are only around 25/25.5 °C (77/78 °F).
When to go
The best periods to visit the cities of Portugal are
from mid-May to mid-June and from mid-September to early October, since in summer it can sometimes get very hot.
On the
coasts, where the heat is less frequent, and generally less intense, you can go in the
summer, also because on very hot days you can seek refuge by the sea.
Winter is mild, but it can be very rainy and windy, especially in the north, and it can be cold in inland areas.
If you want to go on a
beach holiday, the best period is summer, especially July and August (and also the first half of September in the center and south), however, as mentioned, the temperature of the ocean is not high, and is definitely cool on the north coast.
What to pack
In
winter: for Lisbon and the south coast, bring spring/autumn clothes, a sweater, a coat, a rain jacket; you can bring a jacket a bit heavier and a hat for Porto and the northern coast. For inland and mountainous areas: warm clothes, such as a down jacket, a hat, a raincoat or umbrella.
In
summer: bring light clothes, a sun hat, a light scarf for the sea breeze, a sweatshirt for the evening; a sweatshirt and a light jacket for the north and the mountains.
See also the climate of the
Azores islands and of
Madeira.
Climate data - Portugal
| Albufeira |
|---|
|
| Jan | Feb | Mar | Apr | May | Jun | Jul | Aug | Sep | Oct | Nov | Dec |
|---|
| Min temp. | 8 | 9 | 9 | 11 | 13 | 16 | 18 | 18 | 17 | 14 | 11 | 9 |
|---|
| Max temp. | 16 | 16 | 18 | 19 | 22 | 25 | 28 | 28 | 26 | 22 | 19 | 16 |
|---|
| Precip. | 95 | 70 | 55 | 40 | 30 | 15 | 0 | 0 | 15 | 55 | 85 | 100 |
|---|
| Prec. days | 9 | 11 | 7 | 9 | 5 | 2 | 1 | 1 | 2 | 8 | 10 | 12 |
|---|
|
|
| Sun hours | 6 | 6 | 8 | 9 | 10 | 11 | 12 | 12 | 10 | 8 | 6 | 6 |
|---|
| Sea temp | 16 | 16 | 16 | 16 | 18 | 19 | 20 | 21 | 21 | 20 | 19 | 17 |
|---|
| Alcobaça |
|---|
|
| Jan | Feb | Mar | Apr | May | Jun | Jul | Aug | Sep | Oct | Nov | Dec |
|---|
| Min temp. | 6 | 8 | 8 | 10 | 12 | 14 | 16 | 16 | 14 | 13 | 10 | 8 |
|---|
| Max temp. | 14 | 16 | 17 | 19 | 23 | 23 | 25 | 27 | 26 | 23 | 18 | 16 |
|---|
| Precip. | 105 | 100 | 60 | 75 | 65 | 25 | 10 | 10 | 35 | 95 | 125 | 130 |
|---|
| Prec. days | 11 | 11 | 8 | 10 | 9 | 4 | 1 | 2 | 5 | 10 | 11 | 13 |
|---|
|
|
| Sun hours | 5 | 5 | 6 | 7 | 9 | 10 | 11 | 11 | 8 | 6 | 5 | 4 |
|---|
| Sea temp | 15 | 15 | 15 | 15 | 16 | 18 | 19 | 20 | 20 | 19 | 18 | 16 |
|---|
| Aveiro |
|---|
|
| Jan | Feb | Mar | Apr | May | Jun | Jul | Aug | Sep | Oct | Nov | Dec |
|---|
| Min temp. | 6 | 7 | 9 | 10 | 12 | 15 | 16 | 16 | 15 | 13 | 10 | 8 |
|---|
| Max temp. | 14 | 15 | 18 | 18 | 20 | 23 | 24 | 24 | 24 | 21 | 17 | 15 |
|---|
| Precip. | 110 | 85 | 45 | 90 | 90 | 30 | 10 | 20 | 55 | 110 | 130 | 130 |
|---|
| Prec. days | 11 | 10 | 7 | 12 | 10 | 4 | 2 | 2 | 5 | 10 | 12 | 13 |
|---|
|
|
| Sun hours | 4 | 5 | 7 | 8 | 9 | 10 | 11 | 11 | 8 | 7 | 5 | 5 |
|---|
| Sea temp | 14 | 14 | 14 | 15 | 16 | 17 | 18 | 19 | 19 | 18 | 17 | 15 |
|---|
| Beja (245 meters) |
|---|
|
| Jan | Feb | Mar | Apr | May | Jun | Jul | Aug | Sep | Oct | Nov | Dec |
|---|
| Min temp. | 6 | 6 | 8 | 9 | 12 | 14 | 16 | 17 | 15 | 13 | 9 | 7 |
|---|
| Max temp. | 14 | 16 | 19 | 21 | 25 | 30 | 33 | 33 | 29 | 24 | 18 | 15 |
|---|
| Precip. | 65 | 50 | 50 | 55 | 50 | 15 | 0 | 5 | 30 | 80 | 65 | 85 |
|---|
| Prec. days | 8 | 6 | 7 | 7 | 6 | 2 | 0 | 0 | 3 | 8 | 7 | 8 |
|---|
| Humidity | 82% | 78% | 74% | 72% | 64% | 56% | 51% | 52% | 60% | 70% | 79% | 84% |
|---|
| Day length | 10 | 11 | 12 | 13 | 14 | 15 | 14 | 14 | 12 | 11 | 10 | 10 |
|---|
| Sun hours | 5 | 6 | 7 | 8 | 10 | 11 | 12 | 12 | 9 | 7 | 6 | 5 |
|---|
|
| Braga_ |
|---|
|
| Jan | Feb | Mar | Apr | May | Jun | Jul | Aug | Sep | Oct | Nov | Dec |
|---|
| Min temp. | 4 | 5 | 7 | 8 | 10 | 14 | 15 | 15 | 13 | 11 | 8 | 6 |
|---|
| Max temp. | 14 | 15 | 18 | 18 | 21 | 25 | 28 | 28 | 26 | 21 | 17 | 14 |
|---|
| Precip. | 195 | 160 | 100 | 125 | 120 | 60 | 25 | 30 | 80 | 165 | 175 | 230 |
|---|
| Prec. days | 14 | 12 | 10 | 12 | 12 | 7 | 4 | 4 | 6 | 11 | 12 | 14 |
|---|
|
|
| Sun hours | 4 | 4 | 6 | 7 | 8 | 10 | 10 | 10 | 8 | 6 | 5 | 4 |
|---|
| Sea temp | 14 | 14 | 14 | 14 | 16 | 17 | 18 | 19 | 18 | 18 | 16 | 15 |
|---|
| Bragança (670 meters) |
|---|
|
| Jan | Feb | Mar | Apr | May | Jun | Jul | Aug | Sep | Oct | Nov | Dec |
|---|
| Min temp. | 1 | 1 | 4 | 6 | 8 | 12 | 14 | 14 | 12 | 8 | 4 | 2 |
|---|
| Max temp. | 9 | 12 | 15 | 17 | 21 | 26 | 30 | 30 | 25 | 19 | 13 | 10 |
|---|
| Precip. | 100 | 60 | 70 | 65 | 70 | 30 | 15 | 15 | 40 | 100 | 85 | 110 |
|---|
| Prec. days | 10 | 7 | 8 | 9 | 8 | 4 | 2 | 2 | 4 | 9 | 8 | 9 |
|---|
| Humidity | 84% | 74% | 66% | 66% | 62% | 56% | 50% | 49% | 58% | 73% | 81% | 85% |
|---|
| Day length | 10 | 11 | 12 | 13 | 15 | 15 | 15 | 14 | 12 | 11 | 10 | 9 |
|---|
| Sun hours | 4 | 5 | 6 | 7 | 8 | 10 | 12 | 11 | 8 | 6 | 5 | 3 |
|---|
|
| Castelo Branco (385 meters) |
|---|
|
| Jan | Feb | Mar | Apr | May | Jun | Jul | Aug | Sep | Oct | Nov | Dec |
|---|
| Min temp. | 5 | 6 | 7 | 9 | 12 | 15 | 17 | 18 | 16 | 12 | 8 | 5 |
|---|
| Max temp. | 13 | 14 | 18 | 20 | 24 | 29 | 32 | 33 | 28 | 22 | 16 | 13 |
|---|
| Precip. | 110 | 60 | 35 | 60 | 65 | 25 | 10 | 10 | 35 | 105 | 120 | 130 |
|---|
| Prec. days | 8 | 6 | 4 | 8 | 7 | 3 | 1 | 1 | 5 | 8 | 9 | 10 |
|---|
| Humidity | 80% | 73% | 61% | 62% | 59% | 49% | 41% | 43% | 53% | 69% | 78% | 83% |
|---|
| Day length | 10 | 11 | 12 | 13 | 14 | 15 | 15 | 14 | 12 | 11 | 10 | 9 |
|---|
| Sun hours | 5 | 6 | 8 | 8 | 9 | 11 | 11 | 11 | 8 | 6 | 5 | 4 |
|---|
|
| Coimbra |
|---|
|
| Jan | Feb | Mar | Apr | May | Jun | Jul | Aug | Sep | Oct | Nov | Dec |
|---|
| Min temp. | 5 | 6 | 8 | 9 | 11 | 14 | 16 | 15 | 14 | 12 | 9 | 6 |
|---|
| Max temp. | 15 | 16 | 19 | 20 | 22 | 26 | 28 | 29 | 27 | 23 | 18 | 15 |
|---|
| Precip. | 110 | 105 | 65 | 85 | 80 | 40 | 15 | 15 | 50 | 105 | 110 | 125 |
|---|
| Prec. days | 12 | 11 | 8 | 11 | 10 | 5 | 2 | 2 | 5 | 10 | 10 | 12 |
|---|
|
|
| Sun hours | 5 | 5 | 7 | 8 | 9 | 10 | 12 | 11 | 8 | 7 | 5 | 5 |
|---|
|
| Évora (300 meters) |
|---|
|
| Jan | Feb | Mar | Apr | May | Jun | Jul | Aug | Sep | Oct | Nov | Dec |
|---|
| Min temp. | 5 | 5 | 7 | 8 | 11 | 14 | 16 | 16 | 15 | 12 | 8 | 5 |
|---|
| Max temp. | 14 | 16 | 19 | 21 | 25 | 30 | 33 | 34 | 30 | 24 | 18 | 15 |
|---|
| Precip. | 80 | 65 | 40 | 60 | 50 | 20 | 10 | 5 | 30 | 70 | 75 | 105 |
|---|
| Prec. days | 8 | 8 | 6 | 8 | 6 | 3 | 1 | 1 | 3 | 7 | 8 | 10 |
|---|
| Humidity | 79% | 77% | 70% | 68% | 63% | 58% | 52% | 52% | 56% | 67% | 75% | 80% |
|---|
| Day length | 10 | 11 | 12 | 13 | 14 | 15 | 14 | 14 | 12 | 11 | 10 | 10 |
|---|
| Sun hours | 5 | 6 | 7 | 8 | 10 | 11 | 12 | 12 | 9 | 7 | 6 | 5 |
|---|
|
| Faro |
|---|
|
| Jan | Feb | Mar | Apr | May | Jun | Jul | Aug | Sep | Oct | Nov | Dec |
|---|
| Min temp. | 8 | 9 | 11 | 12 | 15 | 18 | 20 | 20 | 18 | 16 | 12 | 10 |
|---|
| Max temp. | 16 | 17 | 19 | 21 | 23 | 27 | 29 | 29 | 26 | 23 | 20 | 17 |
|---|
| Precip. | 60 | 45 | 50 | 35 | 25 | 5 | 0 | 0 | 30 | 55 | 65 | 110 |
|---|
| Prec. days | 7 | 5 | 5 | 5 | 5 | 1 | 0 | 0 | 2 | 6 | 6 | 8 |
|---|
| Humidity | 78% | 75% | 73% | 70% | 67% | 63% | 59% | 62% | 69% | 75% | 76% | 79% |
|---|
| Day length | 10 | 11 | 12 | 13 | 14 | 15 | 14 | 14 | 12 | 11 | 10 | 10 |
|---|
| Sun hours | 6 | 6 | 8 | 8 | 10 | 11 | 12 | 11 | 9 | 7 | 6 | 5 |
|---|
| Sea temp | 16 | 16 | 16 | 17 | 18 | 20 | 21 | 22 | 21 | 20 | 19 | 17 |
|---|
| Lisbon |
|---|
|
| Jan | Feb | Mar | Apr | May | Jun | Jul | Aug | Sep | Oct | Nov | Dec |
|---|
| Min temp. | 9 | 9 | 11 | 12 | 14 | 17 | 18 | 19 | 18 | 15 | 12 | 10 |
|---|
| Max temp. | 15 | 16 | 19 | 20 | 23 | 26 | 28 | 28 | 26 | 23 | 18 | 15 |
|---|
| Precip. | 110 | 80 | 75 | 70 | 60 | 15 | 0 | 5 | 40 | 115 | 135 | 105 |
|---|
| Prec. days | 10 | 8 | 8 | 8 | 5 | 2 | 1 | 1 | 4 | 9 | 10 | 10 |
|---|
| Humidity | 82% | 78% | 73% | 71% | 67% | 64% | 62% | 62% | 66% | 74% | 80% | 84% |
|---|
| Day length | 10 | 11 | 12 | 13 | 14 | 15 | 14 | 14 | 12 | 11 | 10 | 10 |
|---|
| Sun hours | 5 | 6 | 7 | 8 | 9 | 10 | 11 | 11 | 9 | 7 | 5 | 5 |
|---|
| Sea temp | 16 | 15 | 15 | 16 | 17 | 19 | 20 | 20 | 20 | 20 | 18 | 17 |
|---|
| Penhas Douradas (1,400 meters) |
|---|
|
| Jan | Feb | Mar | Apr | May | Jun | Jul | Aug | Sep | Oct | Nov | Dec |
|---|
| Min temp. | 1 | 1 | 3 | 4 | 7 | 11 | 14 | 14 | 11 | 8 | 4 | 2 |
|---|
| Max temp. | 6 | 8 | 9 | 12 | 15 | 20 | 23 | 24 | 20 | 14 | 9 | 7 |
|---|
| Precip. | 200 | 185 | 110 | 140 | 130 | 70 | 25 | 15 | 65 | 180 | 205 | 255 |
|---|
| Prec. days | 13 | 13 | 11 | 12 | 10 | 7 | 3 | 2 | 6 | 11 | 12 | 12 |
|---|
|
|
| Sun hours | 4 | 4 | 5 | 6 | 8 | 9 | 11 | 11 | 8 | 6 | 4 | 4 |
|---|
|
| Peniche |
|---|
|
| Jan | Feb | Mar | Apr | May | Jun | Jul | Aug | Sep | Oct | Nov | Dec |
|---|
| Min temp. | 10 | 10 | 12 | 13 | 14 | 16 | 17 | 17 | 17 | 16 | 13 | 10 |
|---|
| Max temp. | 14 | 14 | 16 | 17 | 18 | 20 | 21 | 21 | 21 | 20 | 17 | 15 |
|---|
| Precip. | 90 | 60 | 100 | 80 | 50 | 0 | 0 | 10 | 30 | 40 | 60 | 90 |
|---|
|
|
|
| Sun hours | 5 | 6 | 7 | 8 | 10 | 10 | 12 | 11 | 9 | 7 | 6 | 5 |
|---|
| Sea temp | 15 | 15 | 15 | 15 | 16 | 18 | 19 | 20 | 20 | 19 | 18 | 16 |
|---|
| Portalegre (500 meters) |
|---|
|
| Jan | Feb | Mar | Apr | May | Jun | Jul | Aug | Sep | Oct | Nov | Dec |
|---|
| Min temp. | 6 | 6 | 8 | 9 | 11 | 15 | 17 | 18 | 16 | 13 | 9 | 7 |
|---|
| Max temp. | 12 | 13 | 16 | 17 | 21 | 27 | 30 | 30 | 27 | 20 | 15 | 12 |
|---|
| Precip. | 110 | 95 | 65 | 80 | 70 | 30 | 10 | 10 | 40 | 100 | 115 | 135 |
|---|
| Prec. days | 10 | 10 | 7 | 9 | 8 | 4 | 1 | 1 | 4 | 9 | 9 | 11 |
|---|
|
|
| Sun hours | 5 | 5 | 6 | 7 | 9 | 10 | 11 | 11 | 8 | 6 | 5 | 5 |
|---|
|
| Porto |
|---|
|
| Jan | Feb | Mar | Apr | May | Jun | Jul | Aug | Sep | Oct | Nov | Dec |
|---|
| Min temp. | 6 | 6 | 8 | 9 | 12 | 14 | 15 | 15 | 14 | 12 | 9 | 7 |
|---|
| Max temp. | 14 | 15 | 17 | 18 | 20 | 23 | 24 | 25 | 24 | 21 | 17 | 15 |
|---|
| Precip. | 160 | 140 | 90 | 115 | 100 | 45 | 20 | 25 | 70 | 140 | 160 | 195 |
|---|
| Prec. days | 13 | 12 | 10 | 11 | 10 | 6 | 3 | 3 | 6 | 11 | 12 | 13 |
|---|
| Humidity | 80% | 77% | 75% | 76% | 76% | 77% | 79% | 79% | 79% | 80% | 81% | 81% |
|---|
| Day length | 10 | 11 | 12 | 13 | 14 | 15 | 15 | 14 | 12 | 11 | 10 | 9 |
|---|
| Sun hours | 4 | 5 | 6 | 7 | 8 | 9 | 10 | 10 | 7 | 6 | 5 | 4 |
|---|
| Sea temp | 14 | 14 | 14 | 14 | 16 | 17 | 18 | 19 | 18 | 18 | 16 | 15 |
|---|
| Sagres |
|---|
|
| Jan | Feb | Mar | Apr | May | Jun | Jul | Aug | Sep | Oct | Nov | Dec |
|---|
| Min temp. | 9 | 9 | 11 | 12 | 14 | 16 | 17 | 18 | 17 | 15 | 12 | 10 |
|---|
| Max temp. | 16 | 16 | 18 | 19 | 21 | 24 | 25 | 26 | 25 | 22 | 19 | 17 |
|---|
| Precip. | 55 | 50 | 55 | 40 | 25 | 5 | 0 | 0 | 20 | 60 | 90 | 75 |
|---|
| Prec. days | 7 | 6 | 7 | 7 | 4 | 1 | 0 | 0 | 2 | 7 | 9 | 8 |
|---|
|
|
| Sun hours | 6 | 6 | 8 | 9 | 10 | 11 | 12 | 12 | 9 | 8 | 6 | 6 |
|---|
|
| Santarém |
|---|
|
| Jan | Feb | Mar | Apr | May | Jun | Jul | Aug | Sep | Oct | Nov | Dec |
|---|
| Min temp. | 6 | 7 | 9 | 10 | 12 | 15 | 16 | 16 | 16 | 13 | 10 | 7 |
|---|
| Max temp. | 15 | 16 | 20 | 21 | 24 | 28 | 31 | 31 | 29 | 24 | 19 | 16 |
|---|
| Precip. | 95 | 80 | 50 | 65 | 55 | 25 | 5 | 5 | 35 | 85 | 90 | 105 |
|---|
| Prec. days | 10 | 10 | 7 | 9 | 7 | 3 | 1 | 1 | 4 | 8 | 9 | 11 |
|---|
|
|
| Sun hours | 5 | 5 | 6 | 7 | 9 | 10 | 11 | 11 | 8 | 6 | 5 | 4 |
|---|
|
| Viana do Castelo |
|---|
|
| Jan | Feb | Mar | Apr | May | Jun | Jul | Aug | Sep | Oct | Nov | Dec |
|---|
| Min temp. | 5 | 6 | 7 | 9 | 11 | 14 | 15 | 15 | 14 | 11 | 8 | 6 |
|---|
| Max temp. | 15 | 16 | 18 | 18 | 21 | 24 | 26 | 26 | 25 | 21 | 17 | 15 |
|---|
| Precip. | 190 | 170 | 105 | 120 | 105 | 55 | 30 | 30 | 95 | 165 | 180 | 230 |
|---|
| Prec. days | 14 | 13 | 10 | 12 | 11 | 7 | 4 | 4 | 7 | 12 | 12 | 15 |
|---|
|
|
| Sun hours | 4 | 5 | 6 | 7 | 8 | 9 | 10 | 9 | 7 | 5 | 5 | 4 |
|---|
| Sea temp | 14 | 14 | 14 | 14 | 16 | 17 | 18 | 19 | 18 | 18 | 16 | 15 |
|---|
| Vila Real (450 meters) |
|---|
|
| Jan | Feb | Mar | Apr | May | Jun | Jul | Aug | Sep | Oct | Nov | Dec |
|---|
| Min temp. | 3 | 4 | 6 | 7 | 10 | 13 | 14 | 15 | 13 | 10 | 6 | 4 |
|---|
| Max temp. | 10 | 12 | 15 | 17 | 22 | 25 | 29 | 29 | 26 | 20 | 13 | 10 |
|---|
| Precip. | 145 | 160 | 85 | 80 | 65 | 55 | 15 | 15 | 50 | 115 | 110 | 175 |
|---|
| Prec. days | 12 | 11 | 9 | 9 | 8 | 6 | 3 | 3 | 5 | 10 | 9 | 11 |
|---|
| Humidity | 84% | 76% | 70% | 71% | 67% | 64% | 59% | 58% | 63% | 75% | 82% | 85% |
|---|
| Day length | 10 | 11 | 12 | 13 | 14 | 15 | 15 | 14 | 12 | 11 | 10 | 9 |
|---|
| Sun hours | 3 | 4 | 6 | 6 | 8 | 9 | 11 | 10 | 8 | 5 | 4 | 3 |
|---|
|
| Viseu (440 meters) |
|---|
|
| Jan | Feb | Mar | Apr | May | Jun | Jul | Aug | Sep | Oct | Nov | Dec |
|---|
| Min temp. | 2 | 3 | 5 | 6 | 9 | 12 | 14 | 14 | 12 | 9 | 6 | 4 |
|---|
| Max temp. | 12 | 14 | 17 | 18 | 21 | 26 | 30 | 30 | 26 | 21 | 16 | 12 |
|---|
| Precip. | 155 | 135 | 75 | 105 | 95 | 45 | 20 | 20 | 55 | 135 | 135 | 195 |
|---|
| Prec. days | 12 | 10 | 8 | 11 | 10 | 5 | 2 | 2 | 6 | 10 | 10 | 13 |
|---|
|
|
| Sun hours | 4 | 5 | 7 | 7 | 9 | 10 | 12 | 11 | 8 | 6 | 5 | 4 |
|---|
|
See also the
temperatures month by month