Select units of measurement for the temperature and rainfall tables (metric or imperial).
Average weather, temperature, rainfall, sunshine hours

The climate of Portalegre is
Mediterranean, with quite mild, rainy winters and hot, sunny summers.
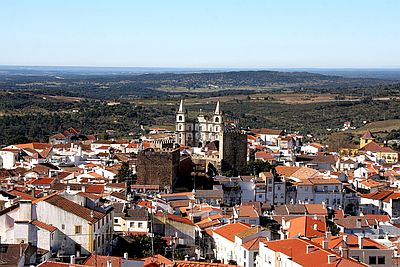
The city is located in the east of Portugal, near the border with Spain, in the Alto Alentejo, at an altitude between 400 and 600 meters (1,300 and 2,000 ft).
The
winter, from December to February, is quite mild.
There are sunny periods that alternate with periods of bad weather.
Sometimes fog can form.
However, given the altitude and the distance from the sea, there may also be some cold periods, with highs of 7/8 °C (45/46 °F) or lower. Sometimes it can even snow, especially in the upper part of the city.
The coldest record is -5 °C (23 °F), recorded in December 1962. In February 1956 and January 1987, the temperature reached -4.5 °C (24 °F).
Summer, from June to mid-September, is hot and sunny, with very rare rains.
The average temperature is the result of different situations. There may be cool periods, in which the night temperature can drop to 10 °C (50 °F) or even below. However, from mid-June to early September, there can be very hot periods, in which the temperature reaches 38/40 °C (100/104 °F).
The temperature reached 42 °C (107.5 °F) in August 2018, and 41 °C (106 °F) in August 2003 and September 2016.

Best Time
The
best times to visit Portalegre are spring and autumn, ie from mid-April to mid-June and from mid-September to early October. In summer, it is generally not too hot, but as we have said, there can be periods of scorching heat.
Portalegre - Climate data
In Portalegre, the
average temperature of the coldest month (January) is of
8.6 °C, that of the warmest month (August) is of
24.1 °C. Here are the average temperatures.
Portalegre - Average temperatures (1981-2010) |
| Month | Min | Max | Mean |
|---|
| January | 5.7 | 11.6 | 8.6 |
|---|
| February | 6.2 | 12.9 | 9.6 |
|---|
| March | 8.2 | 16.3 | 12.2 |
|---|
| April | 8.6 | 17.3 | 13 |
|---|
| May | 11.3 | 21 | 16.2 |
|---|
| June | 15.2 | 26.8 | 21 |
|---|
| July | 17.4 | 30.5 | 24 |
|---|
| August | 17.7 | 30.5 | 24.1 |
|---|
| September | 16.2 | 26.6 | 21.4 |
|---|
| October | 12.8 | 20.2 | 16.5 |
|---|
| November | 9.1 | 14.9 | 12 |
|---|
| December | 6.7 | 12.2 | 9.4 |
|---|
| Year | 11.3 | 20.1 | 15.65 |
|---|
amounts to
850 millimeters per year: so, it is at an intermediate level. It ranges from
10 millimeters in the driest months (July, August) to
135 millimeters in the wettest one (December). Here is the average precipitation.
Portalegre - Average precipitation| Month | Days |
|---|
| January | 110 | 10 |
|---|
| February | 95 | 10 |
|---|
| March | 65 | 7 |
|---|
| April | 80 | 9 |
|---|
| May | 70 | 8 |
|---|
| June | 30 | 4 |
|---|
| July | 10 | 1 |
|---|
| August | 10 | 1 |
|---|
| September | 40 | 4 |
|---|
| October | 100 | 9 |
|---|
| November | 115 | 9 |
|---|
| December | 135 | 11 |
|---|
| Year | 850 | 84 |
|---|
There are on average around 2690
sunshine hours per year. Here are the average hours of sunshine per day.
Portalegre - Sunshine hours| Month | Average | Total |
|---|
| January | 4.5 | 140 |
|---|
| February | 5 | 145 |
|---|
| March | 6.5 | 195 |
|---|
| April | 7 | 205 |
|---|
| May | 9 | 275 |
|---|
| June | 10 | 295 |
|---|
| July | 11.5 | 355 |
|---|
| August | 11 | 340 |
|---|
| September | 8 | 240 |
|---|
| October | 6.5 | 200 |
|---|
| November | 5 | 155 |
|---|
| December | 4.5 | 145 |
|---|
| Year | 7.4 | 2690 |
|---|