Select units of measurement for the temperature and rainfall tables (metric or imperial).
Average weather, temperature, rainfall, sunshine
In Cameroon, the climate is
tropical, semi-arid in the north, and humid and rainy in the rest of the country.
Almost everywhere, there is a dry season in winter and a rainy season in summer due to the
African monsoon, which is shorter in the north and longer in the south, while along the coast, even in winter there can be some showers.
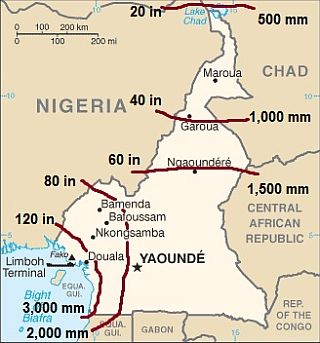
The northernmost part of the country, on the shores of Lake Chad, is the driest area, where less than 600 millimeters (23.5 inches) of rain fall per year, while the wettest is the coast, where rainfall exceeds 3,000 mm (120 in) per year, as can be seen in the following map.
In the southern inland region lies a plateau, located between 500 and 1,200 meters (1,600 and 3,900 feet) above sea level, where the altitude moderates the climate, making the heat more bearable.
The climate in detail
The north
In the north, the climate is
hot and semi-arid, with a rainy season from mid-May to September, while the rest of the year is characterized by hot and dry weather, often scorching.
In the winter months, a dry wind from the desert blows, the
Harmattan, which raises dust, creating a typical mist; sometimes, this wind can also reach the center and the south. Nights can be cool, sometimes even cold: lows can drop to around freezing (0 °C or 32 °F) in the far north.
The northernmost area belongs to the climate zone called Sahel, while more to the south, we find the savannah zone.
Maroua
In
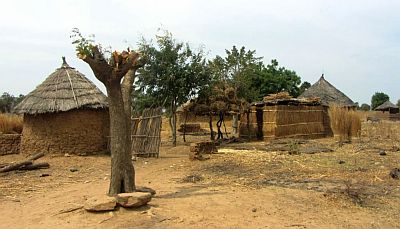
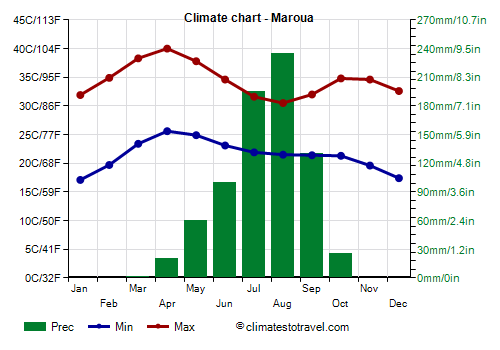
Maroua, a city located at 10 degrees north latitude, in the winter months, it gets hot during the day, while nights can be cool. The hottest period runs from March to May, when the temperature often reaches 40 °C (104 °F); the highest recorded temperatures in this region are about 47/48 °C (117/118 °F).
August is the rainiest month, and also the least hot, the only one in which the average maximum temperature is 30 °C (86 °F), but at this time, the air is moist. After the rains, in October and November, the scorching heat comes back, albeit less intense, around 35 °C (95 °F), with peaks of 40 °C (104 °F).
In Maroua, precipitation amounts to 760 millimeters (30 inches) per year, most of which fall from May to September, with a maximum of 235 mm (9.2 in) in August.
In the north, the sun regularly shines in the long dry season, while in the rainy season, the hours of sunshine decrease a little; the least sunny months are July and August.
The plateau
Proceeding south, in the
south-central plateau, the rainy season it's longer, while the heat is less intense because cloud cover and early rains prevent the temperature from rising in spring, and also because of altitude.
Ngaoundéré
 Ngaoundéré
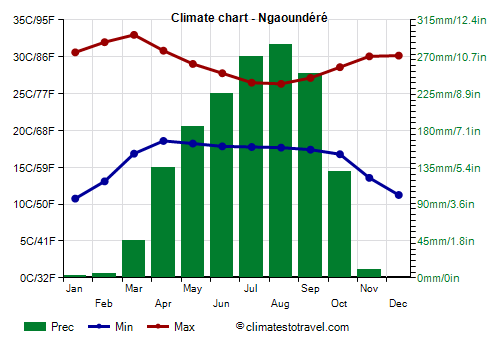
 is located at 1,100 meters (3,600 feet) above sea level, so it can get hot during the day but generally without excesses, while nights can be cool.
In Ngaoundéré, the rainy season runs from April to October, and precipitation amounts to 1,500 mm (60 in) per year, including 285 mm (11 in) in August.
In the northern part of the plateau, the sun regularly shines in the dry season, while in the rainy season, the sky is often cloudy.
Further to the south, in the rest of the plateau of south-central Cameroon, total annual rainfall is still around 1,500 mm (60 in), but the rainy season is even longer, so as to make possible the growth of the forest.
Yaoundé
Even in the capital,
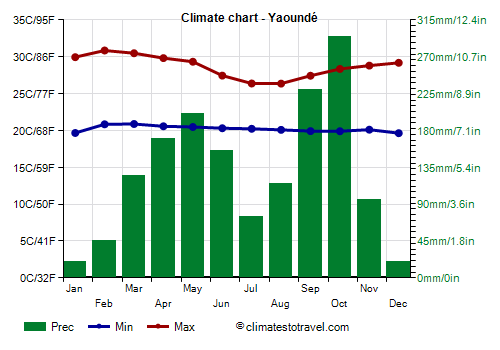
Yaoundé, located at 700 meters (2,300 feet) above sea level, the altitude makes the heat bearable; in fact, average highs are around 30 °C (86 °F) in the dry months and around 27/28 °C (81/82 °F) in the rainy months.
In Yaoundé, 1,500 mm (60 in) of rain fall per year, but the rains occur from March to November, with two peaks in May and October, interrupted by a relative pause in July and August, when they do not exceed 120 mm (4.7 in) per month: in these months, however, the sky is still often cloudy.
In Yaoundé, the sun does not shine very often: in the rainy season, the sky is often cloudy, but even in the driest period, from December to February, the sun doesn't shine so frequently, not going above 6 hours a day.
The coast
Along the
coast, hot and humid weather reigns throughout the year. This is actually the wettest area of Cameroon, where rainfall exceeds 2,000 mm (80 in) per year. In addition to the proximity to the Equator, which results in a strong solar radiation, we must add warm and humid air masses coming from the sea in the period of the African monsoon, which causes heavy rains from May to October, albeit with a decrease in rainfall from mid-June to mid-August in the southern part.
Douala
On the coast (see
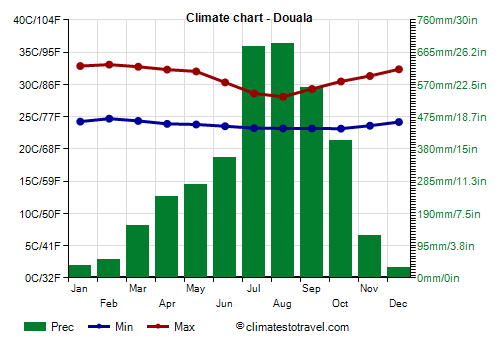
Douala, Kribi), the temperatures are high throughout the year, however, they decrease during the rainy season, when the air is humid, but a lively breeze blows from the ocean.
Douala is the rainiest city in Cameroon, in fact, 3,600 mm (140 in) of rain fall per year, of which more than 500 mm (20 in) fall per month from July to September: so, here, there is no decrease in the mid-summer months; here too, in winter there may be some showers, but a little less frequently than in Kribi.
On average, the coast, like the southern part of the plateau, is never very sunny, even in the driest months.
The
sea temperature in Cameroon is high throughout the year, given that it reaches a minimum of 26.5 °C (80 °F) in August and September.
Around 60 km (37 mi) from Douala, we find the highest peak of the country:
Mount Cameroon, a volcano of 4,040 meters (13,255 feet); up to about 2,500 meters (8,200 ft), the slopes are very rainy and are covered with forests, while above 3,000 meters (9,800 ft), it's cold all year round.
Still on the coast, but further south, in
Kribi, 2,800 mm (110 in) of rain fall per year, with a first peak of 320 mm (12.5 in) in May, a decrease to "only" 125 mm (4.9 in) in July, and a maximum of 500 mm (20 in) in September and October. However, even in December and January, the driest months, the rainfall does not go below 80 mm (3.2 in). So, the climate here is almost equatorial, without a real dry season.
When to go
The best time to visit Cameroon is winter, from
December to February, since it is the driest and sunniest of the year. In the center-south, it's hot during the day, although it can be a bit cool at night on the plateau. In the arid north, it's very hot during the day, while at night, it can get a bit cold.
As early as in February, the heat can be scorching, so you may prefer to visit the north in December and January.
On the coast, the weather in winter is hot and muggy, though with a breeze blowing from the sea; the sky is often overcast especially in the morning, and there can be some showers, especially in the southern part (see Kribi).
What to pack
In
winter: for the north, but also for Yaoundé and the south-central plateau, bring light clothes for the day, loose-fitting and of natural fabric (cotton or linen), a desert turban for the wind-borne sand and dust, a jacket and a sweater for the evening, and comfortable boots or sandals. For the coast, bring light clothing, and a light sweatshirt for the evening. For the top of Mount Cameroon: a down jacket, gloves, a scarf, a hat, and a raincoat.
In
summer: for the north, bring light clothes, a light raincoat or umbrella for the rain showers, and a light sweatshirt. For Yaoundé and the south-central plateau, light clothes, but also a sweater, and a raincoat. For the coast, light clothing, a light sweatshirt, and a light raincoat or umbrella. For the top of Mount Cameroon: warm jacket, gloves, a scarf, a hat, and a raincoat.
Climate data - Cameroon
| Douala |
|---|
|
| Jan | Feb | Mar | Apr | May | Jun | Jul | Aug | Sep | Oct | Nov | Dec |
|---|
| Min temp. | 24 | 25 | 24 | 24 | 24 | 24 | 23 | 23 | 23 | 23 | 24 | 24 |
|---|
| Max temp. | 33 | 33 | 33 | 32 | 32 | 30 | 29 | 28 | 29 | 30 | 31 | 32 |
|---|
| Precip. | 35 | 55 | 155 | 240 | 275 | 355 | 680 | 690 | 560 | 405 | 125 | 30 |
|---|
| Prec. days | 5 | 9 | 15 | 18 | 21 | 23 | 27 | 30 | 26 | 24 | 12 | 5 |
|---|
| Humidity | 83% | 83% | 83% | 85% | 85% | 88% | 90% | 92% | 90% | 88% | 87% | 85% |
|---|
| Day length | 12 | 12 | 12 | 12 | 12 | 12 | 12 | 12 | 12 | 12 | 12 | 12 |
|---|
| Sun hours | 6 | 6 | 6 | 6 | 6 | 4 | 2 | 2 | 3 | 4 | 5 | 6 |
|---|
| Sea temp | 28 | 29 | 29 | 29 | 29 | 28 | 27 | 26 | 27 | 27 | 28 | 28 |
|---|
| Garoua (240 meters) |
|---|
|
| Jan | Feb | Mar | Apr | May | Jun | Jul | Aug | Sep | Oct | Nov | Dec |
|---|
| Min temp. | 18 | 22 | 26 | 28 | 26 | 24 | 24 | 23 | 23 | 24 | 21 | 18 |
|---|
| Max temp. | 34 | 37 | 40 | 40 | 37 | 34 | 32 | 31 | 32 | 34 | 37 | 35 |
|---|
| Precip. | 0 | 0 | 0 | 45 | 110 | 135 | 205 | 250 | 190 | 65 | 0 | 0 |
|---|
| Prec. days | 0 | 0 | 1 | 5 | 9 | 11 | 14 | 17 | 24 | 6 | 1 | 0 |
|---|
|
|
| Sun hours | 9 | 9 | 8 | 8 | 8 | 7 | 6 | 6 | 7 | 8 | 9 | 9 |
|---|
|
| Koumou (350 meters) |
|---|
|
| Jan | Feb | Mar | Apr | May | Jun | Jul | Aug | Sep | Oct | Nov | Dec |
|---|
| Min temp. | 20 | 21 | 21 | 22 | 22 | 21 | 21 | 21 | 21 | 21 | 21 | 21 |
|---|
| Max temp. | 32 | 33 | 33 | 33 | 32 | 31 | 30 | 30 | 31 | 31 | 31 | 31 |
|---|
| Precip. | 55 | 80 | 150 | 130 | 150 | 115 | 80 | 155 | 220 | 220 | 150 | 85 |
|---|
| Prec. days | 4 | 5 | 9 | 8 | 11 | 9 | 6 | 10 | 13 | 14 | 11 | 6 |
|---|
|
|
| Sun hours | 5 | 6 | 5 | 6 | 6 | 5 | 4 | 4 | 4 | 5 | 5 | 5 |
|---|
|
| Kousséri (290 meters) |
|---|
|
| Jan | Feb | Mar | Apr | May | Jun | Jul | Aug | Sep | Oct | Nov | Dec |
|---|
| Min temp. | 15 | 18 | 23 | 26 | 27 | 26 | 24 | 23 | 23 | 23 | 19 | 15 |
|---|
| Max temp. | 33 | 36 | 40 | 42 | 41 | 38 | 34 | 32 | 34 | 37 | 37 | 34 |
|---|
| Precip. | 0 | 0 | 0 | 10 | 25 | 50 | 145 | 175 | 85 | 20 | 0 | 0 |
|---|
| Prec. days | 0 | 0 | 1 | 3 | 6 | 9 | 13 | 15 | 9 | 3 | 1 | 0 |
|---|
|
|
| Sun hours | 10 | 10 | 9 | 9 | 9 | 9 | 7 | 6 | 8 | 9 | 10 | 10 |
|---|
|
| Maroua (425 meters) |
|---|
|
| Jan | Feb | Mar | Apr | May | Jun | Jul | Aug | Sep | Oct | Nov | Dec |
|---|
| Min temp. | 17 | 20 | 23 | 26 | 25 | 23 | 22 | 22 | 21 | 21 | 20 | 17 |
|---|
| Max temp. | 32 | 35 | 38 | 40 | 38 | 35 | 32 | 30 | 32 | 35 | 35 | 33 |
|---|
| Precip. | 0 | 0 | 0 | 20 | 60 | 100 | 195 | 235 | 130 | 25 | 0 | 0 |
|---|
| Prec. days | 0 | 0 | 2 | 3 | 7 | 10 | 15 | 17 | 13 | 4 | 0 | 0 |
|---|
|
| Day length | 12 | 12 | 12 | 12 | 13 | 13 | 13 | 12 | 12 | 12 | 12 | 12 |
|---|
| Sun hours | 9 | 9 | 9 | 8 | 8 | 8 | 6 | 6 | 7 | 8 | 10 | 10 |
|---|
|
| Ngaoundéré (1,100 meters) |
|---|
|
| Jan | Feb | Mar | Apr | May | Jun | Jul | Aug | Sep | Oct | Nov | Dec |
|---|
| Min temp. | 11 | 13 | 17 | 19 | 18 | 18 | 18 | 18 | 17 | 17 | 14 | 11 |
|---|
| Max temp. | 31 | 32 | 33 | 31 | 29 | 28 | 26 | 26 | 27 | 29 | 30 | 30 |
|---|
| Precip. | 5 | 5 | 45 | 135 | 185 | 225 | 270 | 285 | 250 | 130 | 10 | 0 |
|---|
| Prec. days | 0 | 1 | 5 | 13 | 18 | 20 | 22 | 22 | 23 | 15 | 2 | 0 |
|---|
| Humidity | 35% | 32% | 45% | 68% | 79% | 82% | 84% | 84% | 84% | 78% | 57% | 42% |
|---|
| Day length | 12 | 12 | 12 | 12 | 12 | 12 | 12 | 12 | 12 | 12 | 12 | 12 |
|---|
| Sun hours | 9 | 9 | 8 | 7 | 6 | 6 | 4 | 4 | 5 | 6 | 9 | 9 |
|---|
|
| Yaoundé (700 meters) |
|---|
|
| Jan | Feb | Mar | Apr | May | Jun | Jul | Aug | Sep | Oct | Nov | Dec |
|---|
| Min temp. | 20 | 21 | 21 | 21 | 20 | 20 | 20 | 20 | 20 | 20 | 20 | 20 |
|---|
| Max temp. | 30 | 31 | 30 | 30 | 29 | 27 | 26 | 26 | 27 | 28 | 29 | 29 |
|---|
| Precip. | 20 | 45 | 125 | 170 | 200 | 155 | 75 | 115 | 230 | 295 | 95 | 20 |
|---|
| Prec. days | 3 | 4 | 12 | 14 | 17 | 14 | 11 | 12 | 20 | 23 | 11 | 3 |
|---|
| Humidity | 77% | 77% | 81% | 83% | 84% | 87% | 88% | 87% | 87% | 86% | 86% | 82% |
|---|
| Day length | 12 | 12 | 12 | 12 | 12 | 12 | 12 | 12 | 12 | 12 | 12 | 12 |
|---|
| Sun hours | 6 | 6 | 5 | 5 | 5 | 4 | 3 | 3 | 3 | 4 | 6 | 6 |
|---|
|
See also the
temperatures month by month