Select units of measurement for the temperature and rainfall tables (metric or imperial).
Average weather, temperature, rainfall, sunshine
In Honduras, the climate is
tropical at low altitudes, in the
tierras calientes, while it is more temperate at hill altitudes, in the
tierras templadas, while it becomes cold on the mountain tops.
Honduras is a country in Central America, extending from 13 to 16 degrees north latitude, and facing the Caribbean Sea to the north and the Pacific Ocean to the south. The central part is occupied by hills and mountains.
As for the
rains, in the central-south there is a dry season from November to April and a rainy one from May to October, while in the north, there is an area where there is no dry season, and therefore the climate can be defined as
equatorial.
The difference in climate between the two sides is also reflected in
vegetation: the interior and the southern side are dominated by the savanna, while the northern side is covered by rainforest.
Indeed, the
northeast trade winds, which blow in the winter months, are able to pick up moisture from the sea, and then unload rain showers on the north coast and the northern side of the mountains even in this season.
Sometimes, from December to March, Honduras can be reached by
cool air masses from the United States, and in these cases, the temperature at night can drop to around 10 °C (50 °F) in Tegucigalpa, and around 13/15 °C (55/59 °F) in the plains.
For swimming, the
sea in Honduras is warm enough all year round: the water temperature varies between 27 °C and 29 °C (81 °F and 84 °F) in the Caribbean Sea, and is slightly higher in the Pacific Ocean.
The climate in detail
Caribbean coast
In the north, the Caribbean Sea coast, directly exposed to the trade winds, is
very rainy, with a total of 2,600/3,000 millimeters (100/118 inches) per year.
However, even if there is no true dry season, there is usually a decrease in rainfall in the period from
February to April, especially in March and April, more marked on the eastern part (Gracias a Dios Department), where it drops to 50/60 mm (2/2.3 in) per month. On the western part, the decrease in rainfall is less noticeable: in Tela and La Ceiba, it does not go below 80/90 mm (3.1/3.5 in) per month.
By May, the rains increase in frequency in the western part, and also in intensity in the central-eastern part.
In this northern part, the rainfall records are high throughout the year, which means that it can sometimes rain a lot even in the months which are normally less rainy, although
the rainiest period is normally from October to December in the western part (in Tela, 400 mm (16 in) fall per month in this period), while it goes from June to July in the eastern part (in Puerto Lempira, the rainfall in these two months exceeds 400 mm (16 in) per month).
La Ceiba

In La Ceiba, the daytime temperature drops to 28 °C (82.5 °F) in December and January, while it reaches around 32 °C (89.5 °F) from June to September.
From December to March, cool air masses from the United States can bring the night temperature down to 14/15 °C (57/59 °F).
Generally, the highest temperatures occur in the least rainy period: in April and May, the thermometer can mark 37 °C (99 °F).
In La Ceiba, more than 2,600 mm (102 in) of rain fall per year.
In La Ceiba, all in all, the sun shines for a decent number of hours in the long rainy season (at least, if we consider the rainfall frequency), while it shines quite often in the least rainy months, from February to May.
Roatán
In Roatán too, and on the other
Caribbean islands (Guanaja, Útila, Cayos Cochinos), belonging to the Bay Islands Department, the climate is hot all year round, but with a cooler season from November to February and a hotter and muggy season from May to October, and with abundant rains, without a real dry season.
In Roatán, the average temperature ranges from 25.5 °C (78 °F) in January to 29 °C (84 °F) in August and September. Being an island, temperatures are
quite stable, however, from December to March, sometimes they can drop below 20 °C (68 °F), while from April to October, on the hottest days they can reach 33/34 °C (91/93 °F).
In Roatán, 2,700 mm of rain fall per year; the rains are very abundant from October to December, while they drop to acceptable levels from March to May.
The rest of the country (mostly hilly and mountainous, with a small outlet on the Pacific coast) is less rainy: rainfall ranges from 900 to 2,000 mm (35 to 79 in) per annum, and as mentioned experiences a
dry season from November to April, called
el verano, and a
rainy season from May to October, called
el invierno (which, despite its name, "the winter", is a warm and sultry period).
Hills and mountains
As mentioned, the interior of Honduras is made up of hills and mountains.
On the
southern slope and in inland areas, where the rainy season lasts from May to October, there is some decrease in rainfall in July and August, so the rainiest periods are May-June and September-October.
Tegucigalpa

The Honduran capital, Tegucigalpa, is located at 1,000 meters (3,300 feet) above sea level, in the so-called
tierras templadas, and experiences a
more pleasant climate than at sea level: the normal daytime temperature ranges from 26.5 °C (79.5 °F) in December to 31 °C (88 °F) in April.
From December to March, on colder nights, the temperature typically drops to around 10 °C (50 °F), but can sometimes drop lower.
The hottest days typically occur from March to May, when the temperature normally reaches 33/34 °C (91/93 °F), but can sometimes reach 36/37 °C (97/99 °F).
Tegucigalpa is not a very rainy city. The rainfall amounts to 870 mm (34 in) per year, including more than 120 mm (4.7 in) per month in the four rainiest months (which, as we have said, in this area are May-June and September-October). From November to mid-April, it rains very rarely.
The sun in Tegucigalpa shines a little more often than on the north side, since it rains less and the dry season is longer.
 Tegucigalpa
The Mayan archaeological site of
Copán lies at 700 meters (2,300 feet) above sea level, so it is a bit warmer than the capital.
La Esperanza

At higher altitudes, the climate becomes cooler. In
La Esperanza, at 1,700 meters (5,600 feet) above sea level, the average temperature ranges from 15.8 °C (60.4 °F) in January to 19.3 °C (66.7 °F) in May.
From December to March, the minimum temperature can drop to 5 °C (41 °F) or even below.
On warmer days, temperatures typically reach 28/29 °C (82/84 °F) from February to May.
In La Esperanza, 940 mm (37 in) of rain fall per year.
Above 2,000 meters (6,500 feet), night temperatures can be cold, especially in the period from November to March, while above 2,500 meters (8,200 ft), it can get cold even during the day. The highest peak in Honduras is
Cerro Las Minas, 2,870 meters (9,416 ft).
South
 Far south, very hot climate with a rainy season
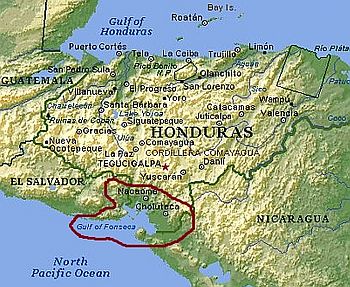
In the far south, in the Valle and Choluteca departments, there is an area overlooking the Gulf of Fonseca, which then opens up to the Pacific Ocean. On the coast there are swamps and mangroves. There are a few islands in the gulf, including Zacate Grande and El Tigre (where the city of Amapala is located).
The northeast trade winds make the Pacific side
very hot and dry, especially in the dry season. This happens because the air warms up as it comes down from the mountains.
In fact, the
daily average temperature reaches 31/32 degrees Celsius (88/90 degrees Fahrenheit) in the hottest months (March and April) in the southern plains, while, as we have seen, it does not go beyond 27/28 °C (80/82 °F) in the northern plains (in the period from May to June, which up there is the hottest). In December and January, the difference is even greater: on the south coast, the daily average is around 29/30 °C (84/86 °F), while on the Caribbean coast, it's around 23/24 °C (73/75 °F).
As for the rains, here too, as in the central part, there is a
rainy period from May to October, within which there is a relative decrease in July.
For swimming, the waters of the Pacific Ocean are also warm all year round.
Choluteca

In Choluteca, located at 13 degrees north latitude and about 30 km (18 mi) from the coast, temperatures are
very high all year round, but especially at the end of the dry season. From March to May, on the hottest days the temperature usually reaches 39/40 °C (102/104 °F), but can sometimes reach higher values.
In Choluteca, 1,700 mm (67 in) of rain fall per year.
The southernmost part of Honduras is very sunny, in fact there are almost 3,000 hours of sunshine per year. The sunniest period is the dry one.
Hurricanes
Honduras is located in the path of
hurricanes, which may hit the country in the period from June to November, however, they are most likely from August to October.
Usually, they come from the east, from the Caribbean Sea, but sometimes, tropical depressions can also form on the Pacific Ocean, which can especially affect the western part of the country, as early as in mid-May, as happened with tropical storm Aletta in late May 1982 and with hurricane Adrian in mid-May 2005.
A particularly destructive hurricane was Fifi in September 1974, another one was Mitch at the end of October 1998.
When to go
The best time to visit Honduras runs from
December to mid-April on the southern side, in Tegucigalpa and in the interior, while on the northern coast, and on the small Caribbean islands belonging to Honduras (the largest of which is Roatán), it only corresponds to the period
from March to May.
To visit the cities and archaeological ruins, up to 1,000 meters (3,300 feet, therefore also in Tegucigalpa), you can prefer the months of
December and January, since in the following months, even though it is still the dry season, it can be very hot.
What to pack
In Tegucigalpa and the
tierras templadas: all year round, bring light clothing, a sweatshirt or sweater, and a jacket for the evening from November to March; a raincoat or umbrella from May to October.
In the
plains and on the coasts: bring lightweight clothes, and a sweater for the evening from December to March; from May to October, tropics-friendly clothing, plus a light sweatshirt and a light raincoat for thunderstorms. When going to the reef, you can bring snorkeling equipment, including water shoes or rubber-soled shoes.
When going to
high mountains, bring warm clothes, a jacket, and hiking boots.
Climate data - Honduras
| Choluteca |
|---|
|
| Jan | Feb | Mar | Apr | May | Jun | Jul | Aug | Sep | Oct | Nov | Dec |
|---|
| Min temp. | 24 | 25 | 25 | 26 | 25 | 24 | 25 | 25 | 24 | 24 | 24 | 24 |
|---|
| Max temp. | 35 | 37 | 37 | 38 | 36 | 34 | 35 | 35 | 34 | 33 | 34 | 35 |
|---|
| Precip. | 0 | 5 | 10 | 30 | 285 | 265 | 140 | 245 | 360 | 275 | 75 | 10 |
|---|
| Prec. days | 0 | 1 | 8 | 3 | 13 | 17 | 10 | 14 | 20 | 15 | 4 | 1 |
|---|
|
|
| Sun hours | 9 | 10 | 9 | 8 | 8 | 7 | 8 | 8 | 6 | 8 | 8 | 9 |
|---|
|
| La Ceiba |
|---|
|
| Jan | Feb | Mar | Apr | May | Jun | Jul | Aug | Sep | Oct | Nov | Dec |
|---|
| Min temp. | 19 | 19 | 20 | 21 | 23 | 23 | 23 | 23 | 23 | 22 | 21 | 20 |
|---|
| Max temp. | 28 | 29 | 30 | 31 | 32 | 32 | 32 | 32 | 32 | 31 | 29 | 28 |
|---|
| Precip. | 275 | 230 | 160 | 85 | 85 | 140 | 145 | 160 | 195 | 350 | 420 | 370 |
|---|
| Prec. days | 16 | 11 | 8 | 6 | 9 | 16 | 19 | 20 | 18 | 20 | 19 | 17 |
|---|
|
|
| Sun hours | 6 | 7 | 7 | 8 | 7 | 6 | 6 | 7 | 6 | 5 | 5 | 5 |
|---|
| Sea temp | 27 | 27 | 27 | 28 | 28 | 29 | 29 | 29 | 29 | 29 | 28 | 28 |
|---|
| La Esperanza (1,700 meters) |
|---|
|
| Jan | Feb | Mar | Apr | May | Jun | Jul | Aug | Sep | Oct | Nov | Dec |
|---|
| Min temp. | 10 | 10 | 11 | 12 | 14 | 14 | 14 | 14 | 14 | 14 | 13 | 11 |
|---|
| Max temp. | 21 | 23 | 25 | 26 | 25 | 24 | 24 | 24 | 24 | 23 | 21 | 21 |
|---|
| Precip. | 15 | 5 | 5 | 35 | 115 | 180 | 85 | 140 | 190 | 125 | 35 | 10 |
|---|
| Prec. days | 1 | 1 | 1 | 4 | 9 | 14 | 10 | 12 | 15 | 11 | 4 | 2 |
|---|
|
|
|
|
| Roatan |
|---|
|
| Jan | Feb | Mar | Apr | May | Jun | Jul | Aug | Sep | Oct | Nov | Dec |
|---|
| Min temp. | 22 | 23 | 24 | 25 | 26 | 26 | 26 | 26 | 26 | 25 | 23 | 23 |
|---|
| Max temp. | 29 | 29 | 30 | 31 | 32 | 32 | 32 | 32 | 32 | 31 | 30 | 29 |
|---|
| Precip. | 275 | 180 | 115 | 75 | 80 | 140 | 200 | 170 | 190 | 445 | 450 | 400 |
|---|
| Prec. days | 18 | 12 | 9 | 6 | 8 | 15 | 20 | 19 | 17 | 21 | 20 | 19 |
|---|
|
|
| Sun hours | 6 | 6 | 7 | 8 | 8 | 7 | 7 | 7 | 7 | 6 | 6 | 6 |
|---|
| Sea temp | 27 | 27 | 27 | 28 | 28 | 29 | 29 | 29 | 29 | 29 | 28 | 27 |
|---|
| San Pedro Sula |
|---|
|
| Jan | Feb | Mar | Apr | May | Jun | Jul | Aug | Sep | Oct | Nov | Dec |
|---|
| Min temp. | 20 | 20 | 21 | 23 | 24 | 24 | 23 | 24 | 24 | 23 | 22 | 21 |
|---|
| Max temp. | 29 | 31 | 33 | 35 | 35 | 34 | 33 | 34 | 34 | 32 | 30 | 29 |
|---|
| Precip. | 40 | 20 | 10 | 10 | 60 | 140 | 160 | 105 | 190 | 150 | 135 | 70 |
|---|
| Prec. days | 6 | 5 | 2 | 2 | 6 | 10 | 10 | 10 | 10 | 10 | 9 | 8 |
|---|
|
|
| Sun hours | 6 | 6 | 8 | 7 | 7 | 7 | 7 | 6 | 6 | 6 | 5 | 5 |
|---|
|
| Santa Rosa de Copan (1,080 meters) |
|---|
|
| Jan | Feb | Mar | Apr | May | Jun | Jul | Aug | Sep | Oct | Nov | Dec |
|---|
| Min temp. | 14 | 14 | 15 | 17 | 18 | 18 | 18 | 18 | 18 | 17 | 16 | 15 |
|---|
| Max temp. | 24 | 26 | 28 | 30 | 29 | 28 | 27 | 27 | 28 | 26 | 24 | 23 |
|---|
| Precip. | 40 | 30 | 25 | 45 | 155 | 290 | 210 | 215 | 295 | 145 | 75 | 60 |
|---|
| Prec. days | 6 | 5 | 3 | 4 | 9 | 16 | 15 | 15 | 16 | 12 | 9 | 8 |
|---|
|
|
|
|
| Tegucigalpa (1,000 meters) |
|---|
|
| Jan | Feb | Mar | Apr | May | Jun | Jul | Aug | Sep | Oct | Nov | Dec |
|---|
| Min temp. | 14 | 14 | 15 | 17 | 18 | 18 | 18 | 18 | 18 | 17 | 16 | 15 |
|---|
| Max temp. | 27 | 28 | 30 | 31 | 30 | 29 | 29 | 29 | 29 | 28 | 27 | 27 |
|---|
| Precip. | 5 | 5 | 10 | 45 | 145 | 160 | 80 | 90 | 175 | 110 | 40 | 10 |
|---|
| Prec. days | 1 | 1 | 1 | 2 | 9 | 12 | 9 | 9 | 13 | 10 | 4 | 2 |
|---|
|
|
| Sun hours | 7 | 8 | 9 | 8 | 7 | 6 | 6 | 7 | 6 | 6 | 7 | 7 |
|---|
|
| Tela |
|---|
|
| Jan | Feb | Mar | Apr | May | Jun | Jul | Aug | Sep | Oct | Nov | Dec |
|---|
| Min temp. | 20 | 21 | 21 | 23 | 24 | 24 | 24 | 24 | 23 | 23 | 21 | 21 |
|---|
| Max temp. | 28 | 29 | 31 | 32 | 32 | 32 | 32 | 32 | 32 | 31 | 29 | 29 |
|---|
| Precip. | 270 | 220 | 120 | 90 | 80 | 150 | 205 | 230 | 245 | 390 | 410 | 420 |
|---|
| Prec. days | 12 | 8 | 5 | 4 | 5 | 9 | 12 | 13 | 12 | 14 | 13 | 13 |
|---|
|
|
|
|
See also the
temperatures month by month