Select units of measurement for the temperature and rainfall tables (metric or imperial).
Average weather, temperature, rainfall, sunshine
Nicaragua, a country of Central America located just north of the Equator, has a
tropical climate, hot all year round.
Temperatures are quite stable; however, there is a relatively cool winter from November to January, a hot spring from March to May, and a sultry and rainy summer from May to October.
In addition, there is a difference between the two sides: the
west coast, facing the Pacific Ocean, is hotter and has a very pronounced dry season from December to April, while the
east coast, overlooking the Caribbean Sea, is more humid and rainy. In fact, the latter, being exposed to the north-east trade winds, receives rainfall even in winter, so the climate here can be defined as
equatorial.
Consequently,
rainfall is abundant on the east coast, from 3,000 to 4,000 millimeters (120 to 160 inches) per year, while it's much less abundant (about 1,200/1,300 mm or 47/51 in) in the central plains, where the city of Managua and the lakes Nicaragua and Managua are located. Along the Pacific coast, the rains amount to 1,700/1,900 mm (67/75 in).
In Nicaragua, the
sea is warm enough for swimming all year round, on both coasts.
The climate in detail
Center-west
In the central-western area of Nicaragua, as mentioned, there is a dry season from December to April and a rainy season from May to October.
However, between July and August there is a period of pause in the rains called
Canícula (dog days), which during some years can be longer than usual.
The hottest period of the year is from March to May.
On the
west coast, it's hot all year round, although there are the sea breezes.
Chinandega

The northern part, near the border with Honduras, is
very hot, so much so that the temperature can reach 39/40 °C (102/104 °F) from March to May.
Chinandega is located in the north-west, 13 km (8 mi) away from the coast and 15 km (9 mi) from Mount San Cristóbal, which is the highest volcano in Nicaragua with its 1,745 meters (5,725 ft). Here, the maximum temperature exceeds 35 °C (95 °F) in March and April.
On average, 1,950 mm (76.5 in) of rain fall per year.
In the southern part, the coast is a little less hot, also due to the presence of Lake Nicaragua (or Cocibolca), which however increases the humidity.
Rivas

In
Rivas, near Lake Nicaragua and 15 km (9 mi) from the southern part of the Pacific coast, the maximum temperature reaches 32.5 °C (90.5 °F) in April, however, the night-time minimums are high and, as mentioned, the humidity is higher.
In Rivas, 1,700 mm (67 in) of rain fall per year, with a dry season from December to April, and abundant rains from June to October.
On the Pacific coast (for example in San Juan del Sur, located on the coast near Rivas), the sea is warm enough for swimming all year round.
Managua
 Managua
, the capital, is located at 12 degrees north latitude and 50 km (30 mi) away from the sea, near a lake that provides moisture, and is a
particularly hot city.
The hottest days of the year are recorded before the rains, from March to May, when temperatures can reach 37/38 °C (98/100 °F), especially in El Niño years, such as 1998 and 2016, which are particularly hot. In May, the first rainy month, the rains slowly begin to lower the temperature. In the period
from June to November, the maximum temperatures are around 32 °C (89.5 °F), but the humidity is higher.
At night, it never gets cold. From November to March, on cooler nights, the temperature generally drops to 18/20 °C (64/68 °F), but sometimes it can drop to 15/16 °C (59/61 °F).
In Managua, 1,200 mm (47 in) of rain fall per year, and the dry season, which runs from December to April, is very pronounced, so much so that it almost never rains. In the rainy season, from May to mid-November, the wettest months are June, September, and October, with more than 200 mm (8 in) of rain per month.
The sun in Managua often shines in the dry period, while in the rainy season, it shines for a few hours a day.

Hills and mountains
 Mountainous areas in Nicaragua
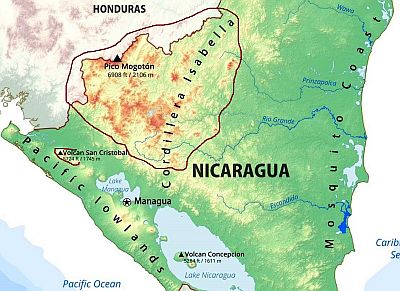
Nicaragua is known as the
land of lakes and volcanoes. Some volcanoes rise directly from the plain, such as the aforementioned San Cristóbal, other rise from lakes, such as Concepción, which emerges from Lake Nicaragua.
In the northern inland region, there is a mountain range, the Cordillera Isabelia. The highest peak in Nicaragua is Pico
Mogotón, 2,107 meters (6,913 ft) high, located on the border with Honduras. Further south we find the Cordillera Chontaleña, which reaches 1,250 meters (4,101 ft) in Cerro Alegre.
In the highlands, the weather becomes mild above 1,000 meters (3,300 feet), in the so-called
tierras templadas.
Jinotega
In
Jinotega, located in the northwest at 1,000 meters (3,300 feet) above sea level and colloquially called "the city of mist", the average temperature ranges from 20.5 °C (69 °F) in January to 24 °C (75 °F) in May.
On cooler nights, the temperature generally drops to 14/15 °C (57/59 °F) from December to March, but can sometimes drop to 11/12 °C (52/54 °F). From March to May, on the hottest days, the temperature generally reaches 30/32 °C (86/90 °F).

Caribbean coast
To the east, on the
Caribbean coast, known as Mosquito Coast, there is no real dry month. Owing to both the rains and the trade winds, the temperatures are a bit lower than on the west coast, especially during the day and from December to April, when in the west it is the dry season, however, the relative humidity is consistently high.
Bluefields

In
Bluefields, the average maximum reaches 30.7 °C (87.3 °F) in April, when, as we have seen, in Chinandega and Managua it exceeds 35 °C (95 °F).
Precipitation in Bluefields amounts to 4,000 mm (160 in) per year; it rains a lot and almost every day from May to December, with a peak in July, with as high as 665 mm (26 in) of rain. March and April are the only months when the rains give a little break, dropping to around 80 mm (3 in) per month, in both cases, in 12 days.
It goes a bit better further to the north, in
Puerto Cabezas, where 3,000 mm (120 in) of rain fall per year, and rainfall drops to less than 100 mm (4 in) already in February.
Since the rains are more frequent and the rainy season is longer, the sun in Bluefields shines less often than in Managua and on the west coast. In particular, from June to August, the sky is often cloudy.
Even on the Caribbean coast, the sea is warm all year round, as we can see from the water temperature in Bluefields.
East of Bluefields, we find two islands, called
Corn Islands (Big Corn Island or
Isla Grande del Maíz and Little Corn Island or
Isla Pequeña del Maíz), which have a similar climate, with the least rainy period from February to April.
Hurricanes
Nicaragua is located in the path of
hurricanes, which come from the east, ie the
Caribbean Sea, and may hit the country in the period from June to November, though they are most likely from August to October. A particularly intense hurricane was Joan-Miriam, which caused serious damage throughout the country in late October 1988, especially in Bluefields, another one was Mitch in late October 1998.
Then, there are the depressions and tropical storms that can be formed on the
Pacific, as early as in mid-May; they are usually not intense because they affect the country in the early stages of their formation, but they can still bring heavy rainfall, which in turn can cause landslides and floods.
When to go
The best time to visit Nicaragua is from
December to April in the central and western part (in Managua and in the northwest, you may prefer December and January, which are a little less hot).
Instead, the best time is limited to March and April along the east coast because of the rains (but after all, you can also go in February, especially in the north, in Puerto Cabezas, where it rains less).
What to pack
For the
tierras templadas and the slopes of volcanoes: all year round, bring light clothing, a sweatshirt or sweater for the evening; a raincoat or umbrella.
For
plains and coasts: bring light clothing, a sweater or sweatshirt for the evening from November to March, and a hat for the sun; in the rainy season (May to mid-November in Managua, and in practice, throughout the year on the east coast), a light raincoat for showers and thunderstorms.
Climate data - Nicaragua
| Bluefields |
|---|
|
| Jan | Feb | Mar | Apr | May | Jun | Jul | Aug | Sep | Oct | Nov | Dec |
|---|
| Min temp. | 23 | 23 | 24 | 25 | 25 | 25 | 25 | 25 | 24 | 24 | 24 | 23 |
|---|
| Max temp. | 29 | 29 | 30 | 31 | 30 | 30 | 29 | 30 | 30 | 30 | 29 | 29 |
|---|
| Precip. | 265 | 130 | 80 | 75 | 345 | 500 | 665 | 545 | 310 | 345 | 390 | 400 |
|---|
| Prec. days | 21 | 16 | 12 | 12 | 22 | 23 | 24 | 24 | 21 | 21 | 22 | 22 |
|---|
|
|
| Sun hours | 5 | 6 | 7 | 7 | 5 | 4 | 3 | 4 | 5 | 5 | 5 | 5 |
|---|
| Sea temp | 27 | 27 | 27 | 28 | 29 | 29 | 28 | 29 | 29 | 29 | 28 | 28 |
|---|
| Chinandega |
|---|
|
| Jan | Feb | Mar | Apr | May | Jun | Jul | Aug | Sep | Oct | Nov | Dec |
|---|
| Min temp. | 22 | 23 | 24 | 25 | 26 | 25 | 24 | 25 | 24 | 24 | 23 | 22 |
|---|
| Max temp. | 34 | 35 | 35 | 35 | 33 | 32 | 33 | 33 | 32 | 31 | 32 | 33 |
|---|
| Precip. | 0 | 0 | 5 | 15 | 255 | 325 | 180 | 250 | 390 | 410 | 70 | 35 |
|---|
| Prec. days | 2 | 2 | 3 | 6 | 17 | 23 | 18 | 20 | 25 | 21 | 8 | 4 |
|---|
|
|
|
|
| Managua |
|---|
|
| Jan | Feb | Mar | Apr | May | Jun | Jul | Aug | Sep | Oct | Nov | Dec |
|---|
| Min temp. | 21 | 22 | 23 | 24 | 25 | 24 | 24 | 24 | 24 | 23 | 22 | 22 |
|---|
| Max temp. | 32 | 33 | 34 | 35 | 34 | 32 | 32 | 33 | 32 | 32 | 32 | 32 |
|---|
| Precip. | 10 | 5 | 5 | 10 | 130 | 225 | 145 | 135 | 215 | 280 | 40 | 10 |
|---|
| Prec. days | 4 | 2 | 2 | 2 | 10 | 22 | 20 | 17 | 20 | 19 | 10 | 5 |
|---|
|
|
| Sun hours | 7 | 8 | 8 | 7 | 6 | 4 | 5 | 6 | 6 | 6 | 7 | 7 |
|---|
|
| Puerto Cabezas |
|---|
|
| Jan | Feb | Mar | Apr | May | Jun | Jul | Aug | Sep | Oct | Nov | Dec |
|---|
| Min temp. | 23 | 24 | 25 | 26 | 27 | 27 | 26 | 26 | 25 | 25 | 24 | 24 |
|---|
| Max temp. | 29 | 29 | 30 | 30 | 31 | 30 | 30 | 30 | 30 | 30 | 30 | 29 |
|---|
| Precip. | 150 | 85 | 50 | 55 | 185 | 380 | 415 | 370 | 305 | 340 | 280 | 200 |
|---|
| Prec. days | 16 | 11 | 7 | 8 | 12 | 20 | 23 | 22 | 20 | 20 | 19 | 20 |
|---|
|
|
|
|
| Rivas |
|---|
|
| Jan | Feb | Mar | Apr | May | Jun | Jul | Aug | Sep | Oct | Nov | Dec |
|---|
| Min temp. | 24 | 25 | 25 | 26 | 26 | 26 | 25 | 26 | 25 | 25 | 25 | 25 |
|---|
| Max temp. | 30 | 30 | 31 | 33 | 32 | 31 | 30 | 31 | 31 | 30 | 30 | 29 |
|---|
| Precip. | 20 | 5 | 5 | 15 | 165 | 275 | 190 | 205 | 300 | 365 | 115 | 40 |
|---|
| Prec. days | 4 | 2 | 1 | 3 | 14 | 20 | 17 | 18 | 22 | 20 | 9 | 6 |
|---|
|
|
| Sun hours | 8 | 8 | 9 | 9 | 8 | 7 | 7 | 6 | 6 | 6 | 8 | 8 |
|---|
| Sea temp | 27 | 27 | 27 | 28 | 29 | 29 | 29 | 29 | 29 | 28 | 28 | 28 |
|---|
See also the
temperatures month by month