Select units of measurement for the temperature and rainfall tables (metric or imperial).
Average weather, temperature, rainfall, sunshine
El Salvador, a small country of Central America located at 13-14 degrees north latitude and overlooking the Pacific Ocean, has a
tropical climate, hot all year round along the coast and below 1,000 meters (3,300 feet), which are called
tierras calientes, with little difference in the temperature (only a few degrees) over the seasons.
The real difference is found in rainfall and humidity: there is a
rainy season from late April to October which is also definitely muggy.
In inland areas, there are
volcanoes, plateaus and mountains, where the weather gets cooler with altitude. At intermediate altitudes, cloud forests are found; at high altitudes, above 2,000 meters (6,500 feet), it can get cold on winter nights. The highest point is
Cerro El Pital, although the summit, 2,730 meters (8,957 feet) high, is located in Honduras; from November to March, you can see the snow on the top.
From December to March, El Salvador is sometimes affected by the
Norte, a cool wind from the United States, which can bring a bit of cool weather in the evening and at night at sea level, with lows around 20 °C (68 °F) on the coast and 16/17 °C (61/63 °F) in inland plains, and even more so in San Salvador, with lows around 13 °C (55 °F).
For a beach holiday, the
sea in El Salvador is warm throughout the year, in fact, the water temperature ranges from 28 °C (82 °F) to 30 °C (86 °F), as we can see in the following table.
The climate in detail
The cities
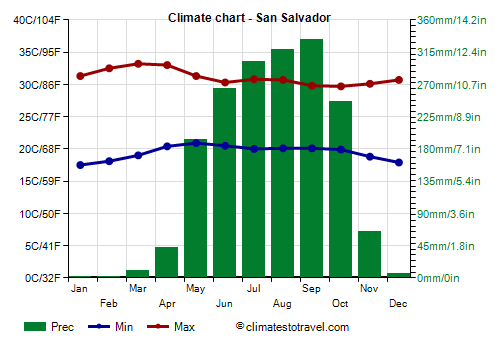
San Salvador

The capital,
San Salvador, is located at 700 meters (2,300 feet) above sea level, so it's still in the
tierras calientes, but the altitude makes the heat more bearable, in fact, the maximum temperature ranges from 30 degrees Celsius (86 °F) between September and November to 33 °C (91.5 °F) in March and April, which are, although slightly, the hottest months, before the rainy season.
The hottest days of the year occur from March to May, when the temperature can reach 35/36 °C (95/99 °F).
The night minimum drops a few degrees below 20 °C (68 °F) from November to April. Anyway, even here, the rainy season, from May to October, is sultry.
In San Salvador, 1,780 millimeters (70.5 inches) of rain fall per year. From July to September, it rains a lot, about 300 mm (12 in) per month, distributed in 16/18 days; on the other hand, it almost never rains from December to March.
Rainfall occurs mainly as downpour or thunderstorm in the afternoon, so the amount of sunshine, which is great in the dry months, remains acceptable even during the rainy season.
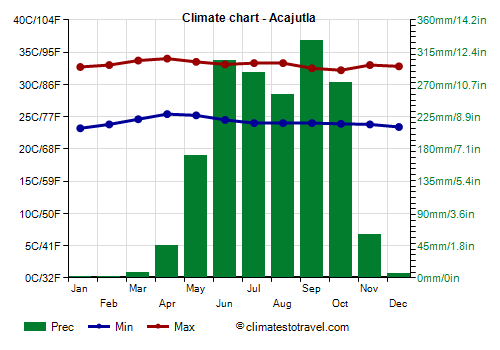
Acajutla

Along the
coast of the Pacific Ocean, the heat is more intens.
During the rainy season (which occurs in the same period as in San Salvador), the weather is hot and muggy.
In
Acajutla, located in the western part of the coast, lows range from 23 °C to 25 °C (73 °F to 77 °F) and highs from 32 °C to 34 °C (89.5 °F to 93 °F). There can be very hot days, especially in March and April, before the rains, when the temperature can sometimes reach 37/38 °C (99/100 °F).
The rains on the coast follow a similar pattern to that of the interior. In Acajutla, they amount to 1,740 mm (68.5 in) per year.
In Acajutla, the sun often shines, more than 3,000 hours a year. The sunniest period is the driest, from December to March.

In the inland valleys located at low altitude, the distance from the sea makes the heat even more uncomfortable because they are not reached by the sea breeze.
Hurricanes
In the period from June to November, but especially between August and October, El Salvador can be affected by
hurricanes.
The hurricanes coming from the east, ie from the
Caribbean Sea, release most of their energy over Honduras, but they can still bring heavy rains in Salvador, especially in inland and mountainous areas.
Then, there are depressions and tropical storms that can be formed on the
Pacific, as early as in mid-May; they are usually not intense because they affect the country in the early stages of their formation, but they can still bring heavy rains, which can in turn cause landslides and floods.
When to go
The best time to visit El Salvador, whether you intend to visit cities and to go on excursions, or to go to the beach, runs from
December to mid-April, since it is the least hot and the driest period of the year.
In the plains, December and January are preferable because they are less hot.
What to pack
All year round, in the plains, bring light, summer clothes, and a light sweatshirt for the evening from December to March; in San Salvador, add a sweater for the evening. From May to October, possibly a light raincoat for thunderstorms.
For the mountains: bring hiking shoes and a jacket.
Climate data - El Salvador
| Acajutla |
|---|
|
| Jan | Feb | Mar | Apr | May | Jun | Jul | Aug | Sep | Oct | Nov | Dec |
|---|
| Min temp. | 23 | 24 | 25 | 25 | 25 | 24 | 24 | 24 | 24 | 24 | 24 | 23 |
|---|
| Max temp. | 33 | 33 | 34 | 34 | 34 | 33 | 33 | 33 | 32 | 32 | 33 | 33 |
|---|
| Precip. | 0 | 0 | 10 | 45 | 170 | 305 | 285 | 255 | 330 | 270 | 60 | 5 |
|---|
| Prec. days | 1 | 0 | 2 | 5 | 10 | 17 | 17 | 17 | 17 | 12 | 3 | 1 |
|---|
|
|
| Sun hours | 10 | 10 | 10 | 9 | 8 | 7 | 8 | 8 | 7 | 8 | 9 | 10 |
|---|
| Sea temp | 28 | 28 | 29 | 30 | 30 | 30 | 30 | 30 | 30 | 29 | 29 | 29 |
|---|
| La Union |
|---|
|
| Jan | Feb | Mar | Apr | May | Jun | Jul | Aug | Sep | Oct | Nov | Dec |
|---|
| Min temp. | 22 | 23 | 24 | 25 | 24 | 24 | 24 | 23 | 23 | 23 | 22 | 22 |
|---|
| Max temp. | 35 | 35 | 36 | 36 | 35 | 34 | 35 | 35 | 33 | 33 | 34 | 34 |
|---|
| Precip. | 0 | 0 | 5 | 30 | 255 | 270 | 150 | 235 | 375 | 290 | 60 | 5 |
|---|
| Prec. days | 0 | 0 | 1 | 2 | 11 | 13 | 10 | 13 | 18 | 14 | 4 | 1 |
|---|
|
|
|
| Sea temp | 28 | 28 | 28 | 29 | 30 | 30 | 30 | 30 | 30 | 29 | 29 | 28 |
|---|
| San Miguel |
|---|
|
| Jan | Feb | Mar | Apr | May | Jun | Jul | Aug | Sep | Oct | Nov | Dec |
|---|
| Min temp. | 19 | 20 | 21 | 23 | 24 | 23 | 23 | 23 | 23 | 22 | 21 | 20 |
|---|
| Max temp. | 37 | 38 | 39 | 38 | 36 | 34 | 36 | 35 | 34 | 33 | 34 | 36 |
|---|
| Precip. | 0 | 0 | 5 | 30 | 210 | 225 | 175 | 245 | 305 | 260 | 60 | 5 |
|---|
| Prec. days | 0 | 0 | 1 | 2 | 11 | 12 | 10 | 14 | 17 | 15 | 4 | 0 |
|---|
|
|
|
|
| San Salvador (700 meters) |
|---|
|
| Jan | Feb | Mar | Apr | May | Jun | Jul | Aug | Sep | Oct | Nov | Dec |
|---|
| Min temp. | 18 | 18 | 19 | 20 | 21 | 20 | 20 | 20 | 20 | 20 | 19 | 18 |
|---|
| Max temp. | 31 | 32 | 33 | 33 | 31 | 30 | 31 | 31 | 30 | 30 | 30 | 31 |
|---|
| Precip. | 0 | 0 | 10 | 40 | 195 | 265 | 300 | 320 | 330 | 245 | 65 | 5 |
|---|
| Prec. days | 0 | 0 | 1 | 4 | 11 | 14 | 16 | 18 | 18 | 13 | 4 | 1 |
|---|
|
|
| Sun hours | 10 | 10 | 9 | 8 | 7 | 6 | 8 | 8 | 6 | 7 | 9 | 9 |
|---|
|
| Santa Ana (665 meters) |
|---|
|
| Jan | Feb | Mar | Apr | May | Jun | Jul | Aug | Sep | Oct | Nov | Dec |
|---|
| Min temp. | 17 | 17 | 18 | 19 | 20 | 20 | 20 | 20 | 20 | 20 | 18 | 18 |
|---|
| Max temp. | 31 | 33 | 34 | 34 | 33 | 31 | 32 | 32 | 31 | 30 | 30 | 30 |
|---|
| Precip. | 0 | 5 | 15 | 60 | 220 | 305 | 290 | 315 | 325 | 215 | 45 | 10 |
|---|
|
|
|
| Sun hours | 10 | 10 | 9 | 9 | 8 | 7 | 8 | 8 | 7 | 7 | 9 | 10 |
|---|
|