Select units of measurement for the temperature and rainfall tables (metric or imperial).
Average weather, temperature, rainfall, sunshine
In Gabon, an African country crossed by the Equator and overlooking the Atlantic Ocean, the climate is
tropical, with a dry, relatively cool season from June to August.
In the central and southern part of the coast, reached by the
Benguela current, the decrease in temperature at this time of year is more evident.
Also, in the far south, the dry season is longer, and it goes from mid-May to mid-September.
The
temperature varies little over the course of the year in the north and the center of the country. The warmest period is from January to May, when highs are equal to or higher than 30 °C (86 °F), while it drops a bit from June to September, hovering around 24/25 °C (75/77 °F) in the central and southern part of the coast and around 27/28 °C (81/82 °F) in inland areas.
Annual
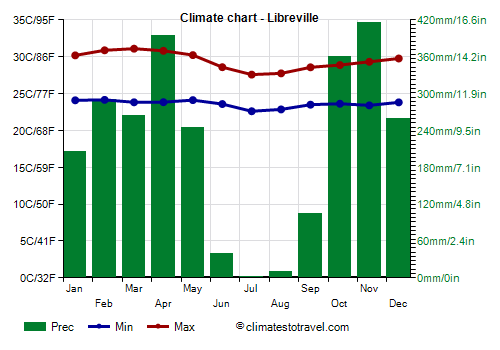
precipitation in most of the country ranges from 1,500 to 2,000 millimeters (60 to 79 inches), while it's close to 3,000 mm (118 in) in the northern part of the coast, where Libreville is located.
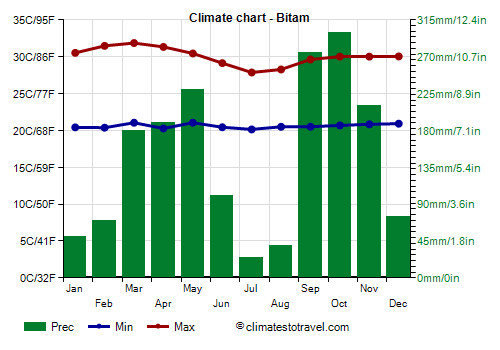
In the northern inland areas, near the Equator (see Bitam, Oyem, Makakou), in addition to the dry season from June to August, there is also a relatively dry season from December to February, so there are two rainy seasons, from March to May and from September to November, caused by the two zenith passages of the sun (that is, when it shines directly overhead in the sky at mid-day).
Much of Gabon is occupied by
forests and mangroves, except the extreme east, which is occupied by the
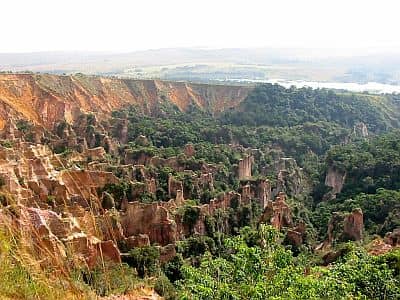
savannah. There are several national parks, designed to protect the biodiversity of the region.
The amount of
sunshine is not great, and it's even worse in the dry season, from June to August, when the sky is often cloudy. The (relatively) sunniest period runs from December to February.
In the interior, there are
hilly areas, where the heat is tempered by altitude. The highest peak in Gabon is Mount Bengoué, which is located in the northeast and is 1,070 meters (3,510 feet) high. In the center of the country, we find the Chaillu Mountains, whose highest peak is Mount Milondo, 1,020 meters (3,346 ft) high.
The climate in detail
The cities
Bitam

In Bitam, situated in the far north, at 600 meters (2,000 feet) above sea level, because of the altitude, the temperatures are a little lower than in the plains.
As mentioned, in the north, there are two rainy seasons, and two relatively dry periods from December to February and from June to August.
In Bitam, the sun does not shine very often, and the least sunny months, when the sky is normally cloudy, are actually the driest, July and August. It goes bit better in the other dry season, from December to February.
Libreville

The capital,
Libreville, is located in the northern part of the coast.
In Libreville, 2,600 mm (102 in) of rain fall per year, with a single dry season from June to August, when it rains very rarely.
In Libreville, the amount of sunshine is overall decent from December to May, even though it is a rainy season, while in the dry period, especially in July and August, the sky is often cloudy.
The
sea in Gabon is warm enough to swim in all year round, even though the water temperature drops a little from July to September, when it goes down to around 25 °C (77 °F) at Libreville, and to around 23 °C (73 °F) in the central and southern part of the coast.
South of Libreville we find
Port Gentil, the second largest city in the country, which has a similar climate, but with a slightly longer dry season (it rarely rains even in September).
Tchibanga

In inland areas, at low altitude (for example in
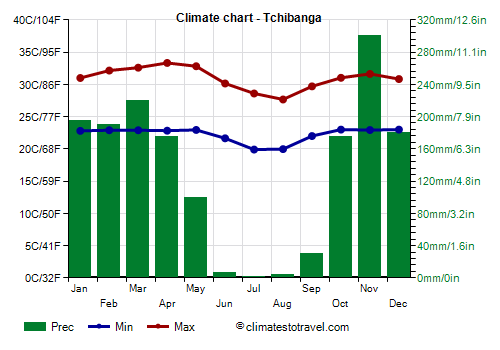
Tchibanga, located in the south, in the plains), maximum temperatures reach 32/33 °C (90/91 °F) between February and May.
As mentioned, the dry season in the south is longer, in fact, it begins in mid-May and lasts until September.
In the south, the sun is even rarer, and here too, the least sunny season is the dry one, when the sky is normally cloudy.

When to go
The best time to visit Gabon is from
June to mid-September, and in particular, the months of July and August, since they are the least rainy, and also the ones in which there have been no anomalies in the rains in the past.
During this period, the heat is not excessive, but the humidity is high and the sky is often cloudy.
Nights can be a little cool in inland areas, while during the day, due to the breeze the air can feel cooler on the coast, especially in the southern part.
What to pack
All year round, bring
light clothes of natural fibers, a light sweatshirt for the evening, an umbrella or a light raincoat during the rainy season. From June to September, you can add a sweatshirt and a light jacket, especially on the central and southern part of the coast and in the hills of the interior.
Climate data - Gabon
| Bitam (600 meters) |
|---|
|
| Jan | Feb | Mar | Apr | May | Jun | Jul | Aug | Sep | Oct | Nov | Dec |
|---|
| Min temp. | 20 | 20 | 21 | 20 | 21 | 20 | 20 | 20 | 21 | 21 | 21 | 21 |
|---|
| Max temp. | 31 | 31 | 32 | 31 | 30 | 29 | 28 | 28 | 30 | 30 | 30 | 30 |
|---|
| Precip. | 50 | 70 | 180 | 190 | 230 | 100 | 25 | 40 | 275 | 300 | 210 | 75 |
|---|
| Prec. days | 4 | 5 | 11 | 14 | 14 | 8 | 4 | 4 | 15 | 20 | 14 | 7 |
|---|
|
|
| Sun hours | 4 | 4 | 4 | 5 | 4 | 4 | 3 | 2 | 3 | 4 | 4 | 4 |
|---|
|
| Franceville (320 meters) |
|---|
|
| Jan | Feb | Mar | Apr | May | Jun | Jul | Aug | Sep | Oct | Nov | Dec |
|---|
| Min temp. | 22 | 22 | 22 | 22 | 22 | 21 | 20 | 21 | 21 | 22 | 21 | 22 |
|---|
| Max temp. | 31 | 31 | 32 | 32 | 31 | 28 | 28 | 29 | 30 | 30 | 30 | 30 |
|---|
| Precip. | 160 | 190 | 220 | 210 | 210 | 35 | 10 | 20 | 110 | 260 | 250 | 190 |
|---|
|
|
|
|
|
| Lambaréné |
|---|
|
| Jan | Feb | Mar | Apr | May | Jun | Jul | Aug | Sep | Oct | Nov | Dec |
|---|
| Min temp. | 23 | 23 | 23 | 23 | 23 | 21 | 20 | 20 | 22 | 22 | 23 | 23 |
|---|
| Max temp. | 32 | 33 | 33 | 33 | 31 | 29 | 28 | 29 | 30 | 31 | 31 | 31 |
|---|
| Precip. | 175 | 145 | 255 | 215 | 160 | 20 | 5 | 5 | 70 | 350 | 395 | 170 |
|---|
| Prec. days | 12 | 11 | 15 | 14 | 14 | 3 | 2 | 5 | 10 | 22 | 21 | 12 |
|---|
|
|
| Sun hours | 5 | 5 | 5 | 5 | 4 | 2 | 2 | 2 | 2 | 2 | 4 | 4 |
|---|
|
| Libreville |
|---|
|
| Jan | Feb | Mar | Apr | May | Jun | Jul | Aug | Sep | Oct | Nov | Dec |
|---|
| Min temp. | 24 | 24 | 24 | 24 | 24 | 24 | 23 | 23 | 24 | 24 | 23 | 24 |
|---|
| Max temp. | 30 | 31 | 31 | 31 | 30 | 29 | 28 | 28 | 29 | 29 | 29 | 30 |
|---|
| Precip. | 205 | 290 | 265 | 395 | 245 | 40 | 0 | 10 | 105 | 360 | 415 | 260 |
|---|
| Prec. days | 14 | 15 | 17 | 19 | 15 | 3 | 0 | 5 | 13 | 22 | 21 | 16 |
|---|
| Humidity | 87% | 86% | 85% | 86% | 86% | 83% | 82% | 83% | 86% | 88% | 89% | 87% |
|---|
| Day length | 12 | 12 | 12 | 12 | 12 | 12 | 12 | 12 | 12 | 12 | 12 | 12 |
|---|
| Sun hours | 6 | 6 | 6 | 6 | 5 | 4 | 4 | 3 | 3 | 4 | 4 | 5 |
|---|
| Sea temp | 28 | 29 | 29 | 29 | 28 | 26 | 26 | 26 | 26 | 27 | 27 | 28 |
|---|
| Mouila |
|---|
|
| Jan | Feb | Mar | Apr | May | Jun | Jul | Aug | Sep | Oct | Nov | Dec |
|---|
| Min temp. | 23 | 23 | 23 | 23 | 23 | 22 | 21 | 21 | 22 | 23 | 23 | 23 |
|---|
| Max temp. | 32 | 33 | 33 | 33 | 32 | 29 | 28 | 28 | 30 | 32 | 32 | 32 |
|---|
| Precip. | 225 | 225 | 250 | 240 | 165 | 20 | 5 | 10 | 50 | 340 | 395 | 230 |
|---|
| Prec. days | 16 | 13 | 16 | 15 | 13 | 3 | 4 | 4 | 9 | 20 | 21 | 16 |
|---|
|
|
|
|
| Port Gentil |
|---|
|
| Jan | Feb | Mar | Apr | May | Jun | Jul | Aug | Sep | Oct | Nov | Dec |
|---|
| Min temp. | 25 | 25 | 25 | 25 | 25 | 24 | 22 | 23 | 24 | 25 | 24 | 25 |
|---|
| Max temp. | 30 | 31 | 31 | 31 | 30 | 28 | 27 | 27 | 28 | 29 | 29 | 30 |
|---|
| Precip. | 250 | 180 | 265 | 300 | 150 | 10 | 5 | 5 | 30 | 180 | 350 | 225 |
|---|
| Prec. days | 15 | 13 | 16 | 16 | 10 | 1 | 0 | 3 | 9 | 17 | 20 | 14 |
|---|
| Humidity | 83% | 82% | 81% | 83% | 84% | 82% | 81% | 80% | 81% | 83% | 85% | 84% |
|---|
| Day length | 12 | 12 | 12 | 12 | 12 | 12 | 12 | 12 | 12 | 12 | 12 | 12 |
|---|
| Sun hours | 5 | 6 | 5 | 5 | 5 | 5 | 5 | 4 | 4 | 4 | 4 | 5 |
|---|
| Sea temp | 28 | 29 | 29 | 29 | 27 | 25 | 24 | 25 | 26 | 26 | 27 | 28 |
|---|
| Tchibanga |
|---|
|
| Jan | Feb | Mar | Apr | May | Jun | Jul | Aug | Sep | Oct | Nov | Dec |
|---|
| Min temp. | 23 | 23 | 23 | 23 | 23 | 22 | 20 | 20 | 22 | 23 | 23 | 23 |
|---|
| Max temp. | 31 | 32 | 33 | 33 | 33 | 30 | 29 | 28 | 30 | 31 | 32 | 31 |
|---|
| Precip. | 195 | 190 | 220 | 175 | 100 | 5 | 0 | 5 | 30 | 175 | 300 | 180 |
|---|
| Prec. days | 14 | 14 | 16 | 15 | 9 | 1 | 1 | 1 | 4 | 16 | 21 | 15 |
|---|
|
|
| Sun hours | 4 | 5 | 5 | 5 | 4 | 3 | 3 | 2 | 1 | 3 | 4 | 4 |
|---|
|
See also the
temperatures month by month