Select units of measurement for the temperature and rainfall tables (metric or imperial).
Average weather, temperature, rainfall, sunshine
In Nigeria, the climate is
tropical, semi-arid in the far north, and progressively rainier as you move southward.
In fact, there is a
rainy season due to the African monsoon, which is progressively longer and more intense from north to south. In the north (see Sokoto, Kano, Maiduguri), the rainy season lasts only four months, from June to September; in the center (see Abuja), it goes from April to October; while in the south (see Lagos, Benin City, Port Harcourt), it goes from March to October; and finally, in the south-east, which is the wettest area (see Calabar), it goes from March to November.
The climate in detail
Temperature and rain
Annual
precipitation is below 500 millimeters (20 inches) in the extreme north-east, on the shores of Lake Chad, it ranges from 1,000 to 1,500 mm (40 to 60 in) in the central region, it exceeds 2,000 mm (80 in) in the south, and it even exceeds 3,000 mm (120 in) in the far south-east.
It follows that the
vegetation varies considerably, in fact, in the north, we find the semi-arid Sahelian landscape, the savannah in the center, the forests in the south, and the mangroves in the Niger Delta and the coastal areas.
From March to May, the rains increase in intensity and frequency and gradually move to the north, until they affect all the country in June.
The rains
cease in mid-September in the far north, and during the month of October in the center, while they linger until November in the far south. Along with sunny weather, hot and dry conditions return in the center-north, while in the south, the humidity remains higher because of the influence of the sea.
The
temperatures also vary in a remarkable way depending on the climatic zones.
In the north,
winter is warm and dry; it can get uncomfortably hot during the day, up to 40 °C (104 °F), but it's usually cool at night, and it can even get cold in the northern hilly areas, where cold records are around freezing (0 °C or 32 °F). By February, the
heat increases in all the inland areas and, in the center-north, it becomes
scorching from March to May, when temperatures can easily reach 40 °C (104 °F).
On the contrary, in the
south, the increase in temperature is limited, both because of the proximity to the ocean and because the rain showers begin earlier.
In the area where the wet front advances, clashing with the existing hot and dry air mass, small tornadoes may form.
From June to September, the air is humid and the sky is usually cloudy throughout the country; temperatures are uniform, and are everywhere around 28/30 °C (82/86 °F); the daytime temperatures are lower than in winter, but relative humidity is higher.
The north
In the north,
winter nights are cool, and sometimes even cold. From March to May, the temperatures increase rapidly, and the heat becomes scorching; in summer, when the monsoon arrives, the temperature decreases, but at the same time, the humidity increases.
In the north, but especially in the far north-east, in the area of
Lake Chad, where the rains are not very heavy even in summer, there is an alternation of rainy and sunny periods, during which the heat returns to be intense, even in the rainy season.
Kano
In
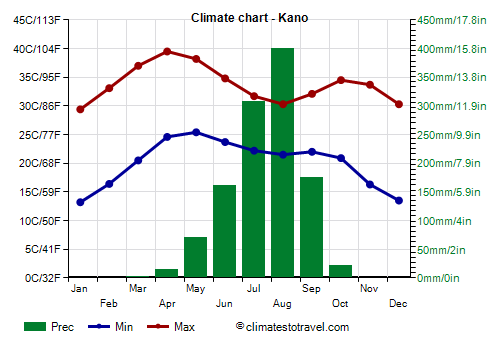
Kano, located at 500 meters (1,600 feet) above sea level, in the north, the average temperature ranges from 21 °C (70 °F) in January to 32 °C (89.5 °F) in April. In the latter month, average highs are of 39.5 °C (103 °F), but in other northern cities located at lower altitudes (see Sokoto, Maiduguri), they are of 41 °C (106 °F).
Precipitation in Kano amounts to 1,150 mm (45 in) per year, but exceeds 150 mm (6 in) per month only from June to September.
In Kano, the sun shines all year round, but in summer, the sunshine hours decrease a little because of the monsoon. July and August, in addition to being the wettest months, are also the least sunny.
The center
In the center,
winter is hot, with highs around 34/35 °C (93/95 °F) in December and January. In this period, the
Harmattan often blows, a wind able to bring dust from the desert and to reduce visibility. But then, the monsoon arrives earlier, so much so that the temperature begins to decrease already during the month of April.
Abuja
In
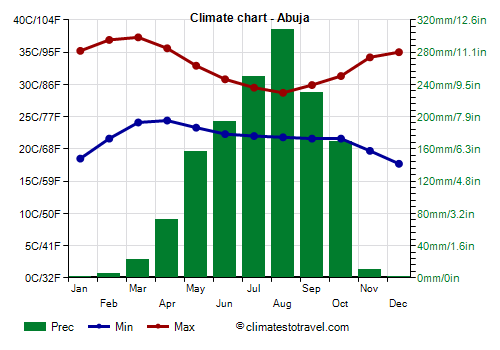
Abuja, the capital, located in the center of the country, at 500 meters (1,600 feet) above sea level, the hottest month is March, with an average of 30.7 °C (87.3 °F), while the coolest is August, with 25.3 °C (77.5 °F).
Rainfall amounts to 1,400 mm (56 in) per year, including more than 100 mm (4 in) per month from May to October.
In the central area, where the rainy season is longer, the sunshine hours decrease for a longer period.
Jos
North-east of Abuja, in the
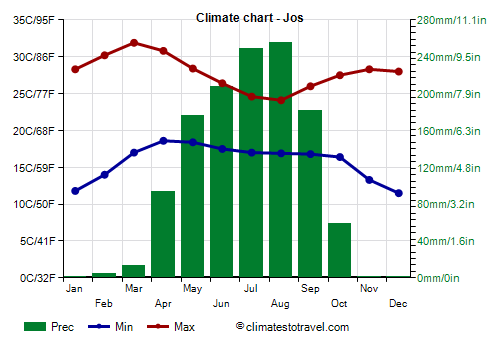
Jos Plateau, the climate is mitigated by the altitude: in Jos, the capital of the Plateau State, located at 1,200 meters (3,900 feet), daytime temperatures range from 28 °C (82 °F) in December to 31/32 °C (88/90 °F) in March and April, while they drop to around 24/25 °C (75/77 °F) in July and August.
The altitude enhances atmospheric instability in the rainy months, so the rains are more abundant than in surrounding areas, and they range from 1,250 mm (49 in) per year in the state capital to more than 1,500 mm (60 in) in the rest of the plateau.
On the border with Cameroon, there is a
mountainous area, where the
Gashaka Gumti National Park is located, and the highest peak is
Chappal Waddi, 2,419 meters (7,936 feet) high. Here, it's cool above 1,500 meters (5,000 feet).
The coast
In the south, in cities located in the coastal area (Lagos, Benin City, Port Harcourt, Calabar),
winter is hot and humid, with highs around 30/32 °C (86/90 °F), though tempered by afternoon breezes.
In addition,
cloudy skies are frequent, at least in the morning, while in the north and center, as mentioned, the winter is sunny. Sometimes, however, the Harmattan can arrive also on the coast.
In this area, the temperature in spring does not increase almost at all, both because of the presence of the sea and because the rains begin early.
Lagos
In
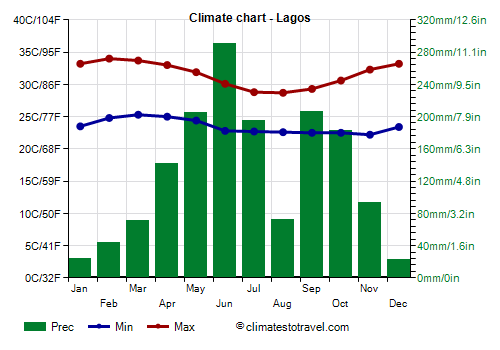
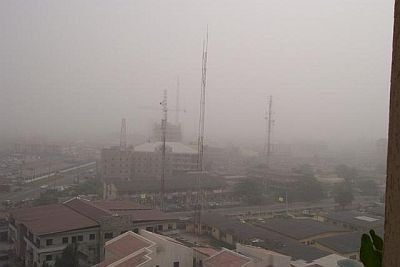
Lagos, a large metropolis, where the urban heat island effect is noticeable, in addition to moisture coming from the sea and the lagoon, the heat is particularly unpleasant, but at least, being on the coast, it receives the breeze from the sea as well.
In the western part of the coast, between mid-July and late August, the rains diminish a bit: in Lagos, June is the wettest month with 290 mm (11.5 in), then the rainfall decreases to 195 mm (7.7 in) in July and to 70 mm (2.8 in) in August, but the sky remains cloudy and moisture high.
In Lagos, and in general in the south of Nigeria, the sun does not shine very often, even in the dry period, while in the rainy season, the sky is often cloudy.
The
sea in Nigeria is warm enough to swim in all year round, although care must be taken with regard to the currents. However, as mentioned, the sun does not shine very often on the coast, even in the dry months.
In the southeast, the rainiest region, the decrease in rainfall in July and August doesn't occur: in
Calabar, where 3,000 mm (120 in) of rain fall per year, rainfall remains around 400 mm (16 in) per month from June to September.
In the south-east of Nigeria, the
Cross River National Park is a hilly area, wet and covered with forests.
When to go
The best time to visit Nigeria is winter, from
November to February, and in particular, the months of January and February, which are the driest and sunniest of the year. It is true that it can get hot during the day almost everywhere, and especially in the center and north, while it can even get cold at night in the far north, and sometimes the Harmattan can bring sand and dust storms, but at least, you avoid the scorching heat of the period from February to May as well as the summer rains.
Already in November, you can find this kind of hot and dry weather, except in the south-east (see Calabar), where it still rains.
The weather in February is similar as well, but very hot days start to be more frequent in inland areas, at some distance from the sea.
What to pack
In
winter: in the north, Jos and Abuja, bring light clothes for the day, long and made of natural fibers (cotton or linen), a desert turban for the wind-borne sand and dust, a jacket and a sweater for the evening, and comfortable and breathable shoes. In the south and in Lagos, bring light clothing, a light sweater for the evening and for air conditioned places, and a light scarf for the wind full of dust.
In
summer: bring lightweight clothing of natural fabrics (cotton or linen), a light raincoat or umbrella for the rain. In Jos, you can add a sweatshirt and a light jacket. It's better for women to avoid shorts and miniskirts, especially in the north.
Climate data - Nigeria
| Abuja (500 meters) |
|---|
|
| Jan | Feb | Mar | Apr | May | Jun | Jul | Aug | Sep | Oct | Nov | Dec |
|---|
| Min temp. | 18 | 22 | 24 | 24 | 23 | 22 | 22 | 22 | 22 | 22 | 20 | 18 |
|---|
| Max temp. | 35 | 37 | 37 | 36 | 33 | 31 | 30 | 29 | 30 | 31 | 34 | 35 |
|---|
| Precip. | 0 | 5 | 20 | 75 | 155 | 195 | 250 | 310 | 230 | 170 | 10 | 0 |
|---|
| Prec. days | 0 | 0 | 2 | 6 | 11 | 12 | 15 | 17 | 16 | 13 | 1 | 0 |
|---|
|
|
| Sun hours | 8 | 8 | 7 | 7 | 7 | 7 | 5 | 5 | 6 | 8 | 9 | 9 |
|---|
|
| Benin City |
|---|
|
| Jan | Feb | Mar | Apr | May | Jun | Jul | Aug | Sep | Oct | Nov | Dec |
|---|
| Min temp. | 23 | 25 | 25 | 24 | 24 | 23 | 23 | 23 | 23 | 23 | 24 | 23 |
|---|
| Max temp. | 34 | 35 | 34 | 33 | 32 | 31 | 29 | 29 | 30 | 31 | 33 | 33 |
|---|
| Precip. | 20 | 35 | 95 | 170 | 215 | 300 | 320 | 210 | 320 | 240 | 75 | 15 |
|---|
| Prec. days | 2 | 4 | 9 | 12 | 16 | 20 | 23 | 19 | 25 | 21 | 7 | 2 |
|---|
|
|
| Sun hours | 6 | 6 | 6 | 6 | 6 | 5 | 3 | 3 | 3 | 5 | 6 | 7 |
|---|
|
| Enugu |
|---|
|
| Jan | Feb | Mar | Apr | May | Jun | Jul | Aug | Sep | Oct | Nov | Dec |
|---|
| Min temp. | 21 | 24 | 25 | 24 | 23 | 23 | 23 | 23 | 22 | 22 | 22 | 20 |
|---|
| Max temp. | 34 | 36 | 35 | 34 | 32 | 31 | 30 | 29 | 30 | 31 | 33 | 33 |
|---|
| Precip. | 20 | 15 | 70 | 130 | 215 | 250 | 240 | 235 | 290 | 200 | 10 | 10 |
|---|
| Prec. days | 1 | 1 | 4 | 7 | 12 | 14 | 16 | 15 | 18 | 12 | 1 | 1 |
|---|
|
|
| Sun hours | 6 | 6 | 6 | 6 | 6 | 5 | 4 | 4 | 4 | 6 | 7 | 7 |
|---|
|
| Ilorin (300 meters) |
|---|
|
| Jan | Feb | Mar | Apr | May | Jun | Jul | Aug | Sep | Oct | Nov | Dec |
|---|
| Min temp. | 19 | 22 | 23 | 23 | 23 | 22 | 22 | 21 | 21 | 22 | 21 | 19 |
|---|
| Max temp. | 34 | 36 | 36 | 34 | 32 | 30 | 29 | 29 | 30 | 31 | 34 | 34 |
|---|
| Precip. | 5 | 20 | 55 | 105 | 150 | 190 | 150 | 155 | 210 | 130 | 5 | 10 |
|---|
| Prec. days | 0 | 1 | 4 | 8 | 10 | 13 | 12 | 11 | 16 | 10 | 1 | 0 |
|---|
|
|
| Sun hours | 7 | 8 | 7 | 7 | 7 | 6 | 4 | 4 | 4 | 6 | 7 | 7 |
|---|
|
| Jos (1,300 meters) |
|---|
|
| Jan | Feb | Mar | Apr | May | Jun | Jul | Aug | Sep | Oct | Nov | Dec |
|---|
| Min temp. | 12 | 14 | 17 | 19 | 18 | 18 | 17 | 17 | 17 | 16 | 13 | 12 |
|---|
| Max temp. | 28 | 30 | 32 | 31 | 28 | 26 | 25 | 24 | 26 | 28 | 28 | 28 |
|---|
| Precip. | 0 | 5 | 15 | 95 | 175 | 205 | 250 | 255 | 180 | 60 | 0 | 0 |
|---|
|
|
|
| Sun hours | 9 | 9 | 8 | 7 | 7 | 7 | 5 | 4 | 6 | 8 | 10 | 9 |
|---|
|
| Kano (475 meters) |
|---|
|
| Jan | Feb | Mar | Apr | May | Jun | Jul | Aug | Sep | Oct | Nov | Dec |
|---|
| Min temp. | 13 | 16 | 20 | 25 | 25 | 24 | 22 | 22 | 22 | 21 | 16 | 14 |
|---|
| Max temp. | 29 | 33 | 37 | 40 | 38 | 35 | 32 | 30 | 32 | 34 | 34 | 30 |
|---|
| Precip. | 0 | 0 | 0 | 15 | 70 | 160 | 305 | 400 | 175 | 20 | 0 | 0 |
|---|
| Prec. days | 0 | 0 | 0 | 1 | 4 | 8 | 11 | 14 | 8 | 2 | 0 | 0 |
|---|
|
|
| Sun hours | 8 | 8 | 8 | 8 | 8 | 9 | 7 | 7 | 8 | 9 | 9 | 8 |
|---|
|
| Lagos |
|---|
|
| Jan | Feb | Mar | Apr | May | Jun | Jul | Aug | Sep | Oct | Nov | Dec |
|---|
| Min temp. | 24 | 25 | 25 | 25 | 24 | 23 | 23 | 23 | 22 | 22 | 22 | 23 |
|---|
| Max temp. | 33 | 34 | 34 | 33 | 32 | 30 | 29 | 29 | 29 | 31 | 32 | 33 |
|---|
| Precip. | 25 | 45 | 70 | 140 | 205 | 290 | 195 | 70 | 205 | 185 | 95 | 25 |
|---|
| Prec. days | 1 | 2 | 5 | 7 | 11 | 15 | 11 | 7 | 13 | 12 | 6 | 2 |
|---|
| Humidity | 71% | 77% | 78% | 80% | 83% | 87% | 87% | 86% | 87% | 87% | 83% | 78% |
|---|
| Day length | 12 | 12 | 12 | 12 | 12 | 12 | 12 | 12 | 12 | 12 | 12 | 12 |
|---|
| Sun hours | 5 | 6 | 6 | 6 | 6 | 4 | 3 | 4 | 4 | 5 | 6 | 6 |
|---|
| Sea temp | 28 | 28 | 29 | 29 | 29 | 28 | 26 | 26 | 26 | 28 | 29 | 28 |
|---|
| Maiduguri (320 meters) |
|---|
|
| Jan | Feb | Mar | Apr | May | Jun | Jul | Aug | Sep | Oct | Nov | Dec |
|---|
| Min temp. | 13 | 16 | 20 | 24 | 26 | 25 | 24 | 23 | 23 | 22 | 17 | 14 |
|---|
| Max temp. | 33 | 35 | 39 | 41 | 40 | 37 | 33 | 31 | 33 | 36 | 36 | 33 |
|---|
| Precip. | 0 | 0 | 0 | 15 | 30 | 75 | 145 | 195 | 85 | 10 | 0 | 0 |
|---|
| Prec. days | 0 | 0 | 0 | 2 | 4 | 7 | 11 | 11 | 7 | 1 | 0 | 0 |
|---|
|
|
| Sun hours | 9 | 9 | 8 | 8 | 8 | 8 | 7 | 7 | 8 | 9 | 9 | 9 |
|---|
|
| Port Harcourt |
|---|
|
| Jan | Feb | Mar | Apr | May | Jun | Jul | Aug | Sep | Oct | Nov | Dec |
|---|
| Min temp. | 21 | 23 | 25 | 24 | 23 | 23 | 23 | 22 | 23 | 23 | 23 | 22 |
|---|
| Max temp. | 33 | 34 | 33 | 33 | 32 | 30 | 29 | 29 | 29 | 32 | 32 | 33 |
|---|
| Precip. | 20 | 55 | 115 | 185 | 225 | 275 | 355 | 325 | 365 | 265 | 95 | 25 |
|---|
| Prec. days | 2 | 5 | 9 | 12 | 14 | 16 | 20 | 20 | 20 | 14 | 6 | 2 |
|---|
|
|
| Sun hours | 5 | 4 | 4 | 4 | 4 | 3 | 2 | 2 | 3 | 3 | 4 | 5 |
|---|
|
| Sokoto (300 meters) |
|---|
|
| Jan | Feb | Mar | Apr | May | Jun | Jul | Aug | Sep | Oct | Nov | Dec |
|---|
| Min temp. | 15 | 17 | 21 | 24 | 25 | 23 | 22 | 21 | 22 | 21 | 18 | 16 |
|---|
| Max temp. | 32 | 35 | 39 | 40 | 39 | 36 | 32 | 31 | 32 | 36 | 36 | 32 |
|---|
| Precip. | 0 | 0 | 0 | 5 | 45 | 80 | 185 | 200 | 110 | 15 | 0 | 0 |
|---|
| Prec. days | 0 | 0 | 0 | 1 | 4 | 7 | 11 | 14 | 8 | 2 | 0 | 0 |
|---|
|
|
| Sun hours | 9 | 10 | 9 | 8 | 9 | 9 | 7 | 6 | 8 | 10 | 10 | 10 |
|---|
|
| Yola |
|---|
|
| Jan | Feb | Mar | Apr | May | Jun | Jul | Aug | Sep | Oct | Nov | Dec |
|---|
| Min temp. | 18 | 21 | 25 | 27 | 26 | 24 | 23 | 23 | 23 | 23 | 19 | 17 |
|---|
| Max temp. | 34 | 37 | 40 | 40 | 36 | 34 | 32 | 31 | 31 | 33 | 35 | 34 |
|---|
| Precip. | 0 | 0 | 5 | 45 | 95 | 130 | 185 | 195 | 170 | 55 | 0 | 0 |
|---|
| Prec. days | 0 | 0 | 1 | 4 | 9 | 11 | 12 | 16 | 13 | 6 | 0 | 0 |
|---|
|
|
| Sun hours | 8 | 8 | 8 | 8 | 8 | 8 | 6 | 6 | 7 | 8 | 9 | 9 |
|---|
|
See also the
temperatures month by month