Select units of measurement for the temperature and rainfall tables (metric or imperial).
Average weather, temperature, rainfall, sunshine hours
Index
Introduction
In Aragon, an autonomous community and province of northern Spain, there are the following climatic zones:
- the Pyrenean range in the far north, on the border with France, characterized by an alpine climate (cold mountain climate);
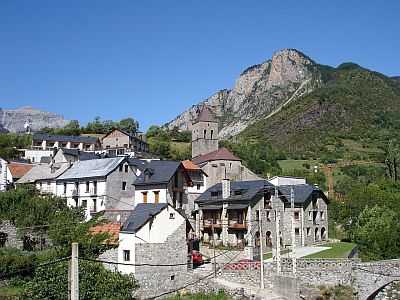
- the pre-Pyrenean range in the north, in valleys and slopes at low-mountain elevations (see Jaca, Bielsa), where the weather is cold in winter and mild in summer, with some hot days, and relatively abundant rainfall;
- all the center-south, at medium-low altitudes, is characterized by an arid or semi-arid climate, and more or less warm depending on altitude, so we have a transitional Mediterranean (slightly continental) climate in the Ebro Valley (see Zaragoza), with quite mild winters and hot summers, often scorching, while above 600 meters (2,000 feet), there is a semi-continental climate, similar to that of the central plateau of Spain (
meseta);
- in the center-south, there is another mountain range, the Iberian System (
Sistema Ibérico): here, the climate becomes colder with increasing altitude, while rain (and snow in winter) becomes more abundant, so much so that the mountains are covered with forests.
Pyrenees
In the far north, on the border with France, we find the chain of the
Pyrenees; the highest peak of the entire chain,
Pico de Aneto, 3,404 meters (11,168 feet) high, is located in Aragon. Above 2,700 meters (9,000 feet), there are glaciers, which are among the most southern in Europe (together with the small Calderone glacier in Abruzzo, Italy, and the glaciers of Caucasus).
In the Pyrenean area, we find the
Ordesa y Monte Perdido National Park.
In the area at the foot of the Pyrenees, at the same altitude, the climate is cooler than in the south-central part of the region; in addition, this area is exposed to cold air outbreaks in winter, with strong winds.
Jaca
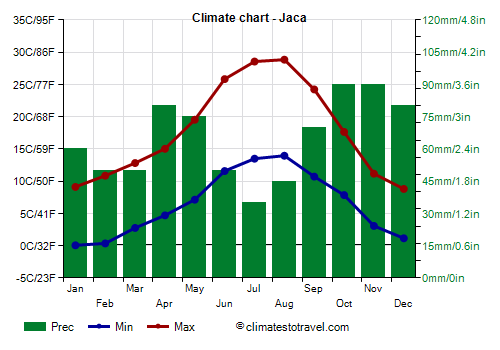
In
Jaca, located at the foot of the Pyrenees, at 800 meters (2,600 feet) above sea level, the average temperature ranges from 4.5 °C (40 °F) in January to 21.5 °C (70.5 °F) in August. Therefore, winter is cold, and sometimes, there can be heavy snowfalls. Although the summer averages are not too high, there can be some hot days.
Here are the average temperatures.
Jaca - Average temperatures (2000-2020) |
| Month | Min | Max | Mean |
|---|
| January | 0.1 | 9.1 | 4.6 |
|---|
| February | 0.4 | 10.8 | 5.6 |
|---|
| March | 2.8 | 12.8 | 7.8 |
|---|
| April | 4.7 | 15 | 9.9 |
|---|
| May | 7.1 | 19.5 | 13.3 |
|---|
| June | 11.6 | 25.8 | 18.7 |
|---|
| July | 13.5 | 28.5 | 21 |
|---|
| August | 14 | 28.8 | 21.4 |
|---|
| September | 10.7 | 24.2 | 17.5 |
|---|
| October | 7.8 | 17.6 | 12.7 |
|---|
| November | 3.1 | 11.2 | 7.1 |
|---|
| December | 1.2 | 8.8 | 5 |
|---|
| Year | 6.4 | 17.7 | 12.05 |
|---|
In Jaca, 770 millimeters (30.3 inches) of rain or snow fall, well distributed throughout the year, with a maximum in April of 80 mm (3.1 in) and a minimum in July of 35 mm (1.4 in). The latter is not very pronounced, since a few Atlantic fronts can affect this area even in summer, in addition, some thunderstorms can erupt in the afternoon.
Jaca - Average precipitation| Month | Days |
|---|
| January | 60 | 10 |
|---|
| February | 50 | 9 |
|---|
| March | 50 | 9 |
|---|
| April | 80 | 12 |
|---|
| May | 75 | 13 |
|---|
| June | 50 | 7 |
|---|
| July | 35 | 6 |
|---|
| August | 45 | 6 |
|---|
| September | 70 | 8 |
|---|
| October | 90 | 11 |
|---|
| November | 90 | 11 |
|---|
| December | 80 | 11 |
|---|
| Year | 770 | 112 |
|---|
Center-south
Huesca
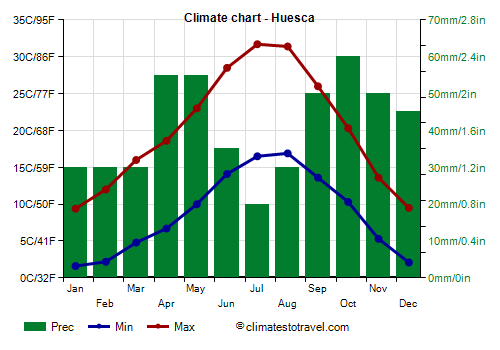
In
Huesca, located in the center-north, at no great distance from the Pyrenees and at 480 meters (1,570 ft) of altitude, we already enter the zone with a semi-arid climate and hot summers. Here, the monthly average temperature ranges from 5.5 °C (42 °F) in January to 24.5 °C (76 °F) in July. In winter, there can be cold spells, with night frosts, and when the weather is stable, cold and foggy periods may occur. In summer, days with intense heat are possible, although the air is dry and nights remain cool.
Huesca - Average temperatures (1991-2020) |
| Month | Min | Max | Mean |
|---|
| January | 1.6 | 9.4 | 5.5 |
|---|
| February | 2.2 | 12 | 7.1 |
|---|
| March | 4.8 | 16 | 10.4 |
|---|
| April | 6.7 | 18.6 | 12.6 |
|---|
| May | 10 | 23 | 16.5 |
|---|
| June | 14.1 | 28.5 | 21.3 |
|---|
| July | 16.5 | 31.7 | 24.1 |
|---|
| August | 16.9 | 31.4 | 24.2 |
|---|
| September | 13.6 | 26 | 19.8 |
|---|
| October | 10.3 | 20.3 | 15.3 |
|---|
| November | 5.3 | 13.6 | 9.4 |
|---|
| December | 2.1 | 9.5 | 5.8 |
|---|
| Year | 8.7 | 20 | 14.35 |
|---|
In Huesca, 485 mm (19 in) of rain fall per year, with two maxima in spring and autumn, and quite poor rains, but not entirely absent, in winter (when they are a bit more common but not abundant) and in summer (when rare thunderstorms can break out).
Huesca - Average precipitation| Month | Days |
|---|
| January | 30 | 5 |
|---|
| February | 30 | 5 |
|---|
| March | 30 | 4 |
|---|
| April | 55 | 6 |
|---|
| May | 55 | 7 |
|---|
| June | 35 | 4 |
|---|
| July | 20 | 3 |
|---|
| August | 30 | 3 |
|---|
| September | 50 | 5 |
|---|
| October | 60 | 7 |
|---|
| November | 50 | 6 |
|---|
| December | 45 | 6 |
|---|
| Year | 485 | 62 |
|---|
Zaragoza
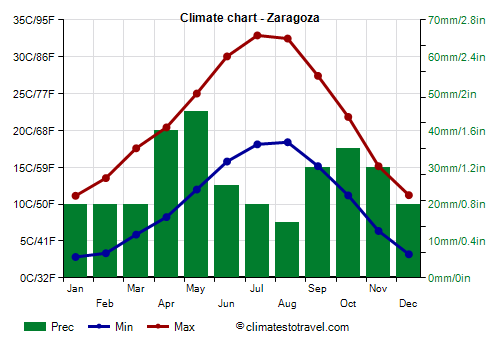
Further to the south, we find
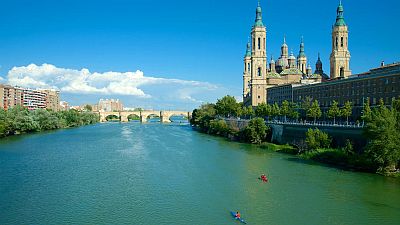
Zaragoza, located in the Ebro Valley, 250 meters (820 feet) above sea level, ie in the area where the altitude is lower, and the climate can be described as transitional Mediterranean. Here, the average temperature ranges from 7 °C (44.5 °F) in January to 25.5 °C (78 °F) in July and August. In winter, nights are often cold, with possible slight frosts. In summer, hot days are frequent, however, the air is dry, and the temperature drops considerably at night.
Zaragoza - Average temperatures (1991-2020) |
| Month | Min | Max | Mean |
|---|
| January | 2.8 | 11.1 | 7 |
|---|
| February | 3.4 | 13.5 | 8.4 |
|---|
| March | 5.9 | 17.6 | 11.7 |
|---|
| April | 8.2 | 20.4 | 14.3 |
|---|
| May | 12 | 25 | 18.5 |
|---|
| June | 15.8 | 30 | 22.9 |
|---|
| July | 18.1 | 32.9 | 25.5 |
|---|
| August | 18.4 | 32.5 | 25.4 |
|---|
| September | 15.2 | 27.4 | 21.3 |
|---|
| October | 11.2 | 21.8 | 16.5 |
|---|
| November | 6.4 | 15.2 | 10.8 |
|---|
| December | 3.2 | 11.2 | 7.2 |
|---|
| Year | 10.1 | 21.6 | 15.8 |
|---|
In Zaragoza and in the Ebro valley, a cold, dry north-west wind can blow, the
cierzo.
In Zaragoza, only 330 mm of rain fall annually; winter is particularly dry, in fact, only 20 mm (0.8 in) of rain fall each month.
Zaragoza - Average precipitation| Month | Days |
|---|
| January | 20 | 4 |
|---|
| February | 20 | 4 |
|---|
| March | 20 | 4 |
|---|
| April | 40 | 6 |
|---|
| May | 45 | 7 |
|---|
| June | 25 | 4 |
|---|
| July | 20 | 3 |
|---|
| August | 15 | 2 |
|---|
| September | 30 | 3 |
|---|
| October | 35 | 5 |
|---|
| November | 30 | 5 |
|---|
| December | 20 | 5 |
|---|
| Year | 330 | 52 |
|---|
The amount of
sunshine in Zaragoza is not bad, in fact, some sunny day can occur all year round, although it is better, as happens in Mediterranean climates, in late spring and summer, especially from May to August, when sunny days prevail. Here are the average sunshine hours per day.
Zaragoza - Sunshine hours| Month | Average | Total |
|---|
| January | 4 | 130 |
|---|
| February | 6 | 165 |
|---|
| March | 7 | 215 |
|---|
| April | 7.5 | 225 |
|---|
| May | 9 | 275 |
|---|
| June | 10 | 305 |
|---|
| July | 11 | 350 |
|---|
| August | 10 | 315 |
|---|
| September | 8 | 245 |
|---|
| October | 6.5 | 195 |
|---|
| November | 5 | 150 |
|---|
| December | 4 | 125 |
|---|
| Year | 7.4 | 2695 |
|---|
East of Zaragoza, we find the
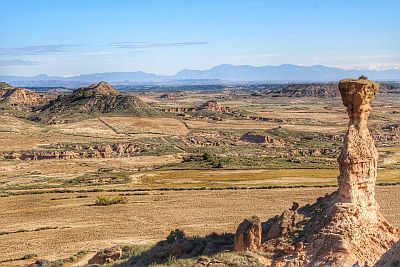
Monegros Desert (which is actually a semi-desert zone), where rainfall drops below 300 mm (12 in) per year.
In the center-south of Aragon, the altitude rises again because of the presence of the mountain chain called
Sistema Ibérico, whose highest point is San Miguel, in the Moncayo Massif, 2,314 meters (7,592 feet) high.
The pole of cold
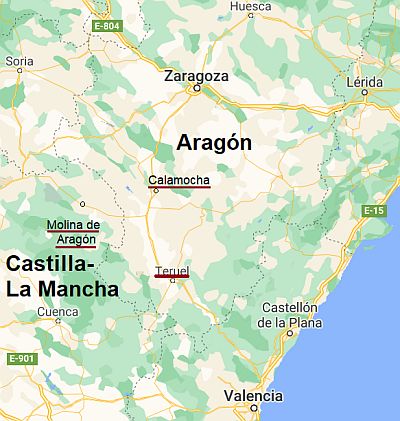
Between the south-west of Aragon and the north-east of Castile-La Mancha, we find a plateau between the mountains of the Ibérico System, at an altitude of 900/1,100 meters (3,000/3,600 feet), which is considered the
pole of cold in Spain. It has the shape of a triangle, whose vertices are the towns of
Molina de Aragón (in Castile-La Mancha), Calamocha (south of
Daroca) and Teruel. In this area, during the most intense cold waves, with clear skies, snow on the ground and no wind, the temperature can drop below -25 °C (-13 °F). In January 2021, in Bello, in the province of Teruel, the temperature dropped to -25.4 °C (-13.7 °F), while in December 1963, in Fuentes Claras, it dropped to -30 °C (-22 °F).
Teruel
In
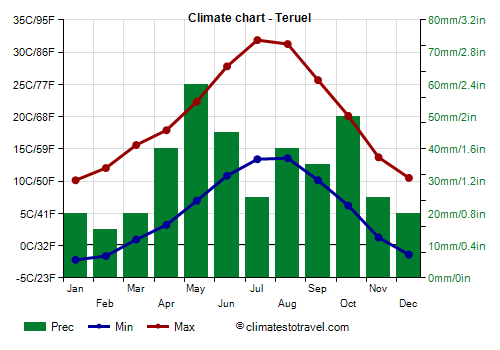
Teruel, the capital of the southernmost province of Aragon, 900 meters (2,950 feet) above sea level, the average temperature ranges from 4 °C (39 °F) in January to 22.5 °C (72.5 °F) in July. It can be seen that the minimum temperatures are low all year round.
Teruel - Average temperatures (1991-2020) |
| Month | Min | Max | Mean |
|---|
| January | -2.2 | 10.1 | 4 |
|---|
| February | -1.6 | 12 | 5.2 |
|---|
| March | 0.9 | 15.6 | 8.3 |
|---|
| April | 3.2 | 17.9 | 10.6 |
|---|
| May | 7 | 22.3 | 14.6 |
|---|
| June | 10.8 | 27.8 | 19.3 |
|---|
| July | 13.4 | 31.9 | 22.6 |
|---|
| August | 13.6 | 31.3 | 22.4 |
|---|
| September | 10.2 | 25.7 | 17.9 |
|---|
| October | 6.2 | 20.1 | 13.2 |
|---|
| November | 1.3 | 13.7 | 7.5 |
|---|
| December | -1.4 | 10.5 | 4.6 |
|---|
| Year | 5.2 | 20 | 12.55 |
|---|
In an average year, 390 mm (15.3 in) of rain fall in Teruel. The driest season is even the winter.
Teruel - Average precipitation| Month | Days |
|---|
| January | 20 | 4 |
|---|
| February | 15 | 3 |
|---|
| March | 20 | 4 |
|---|
| April | 40 | 7 |
|---|
| May | 60 | 8 |
|---|
| June | 45 | 6 |
|---|
| July | 25 | 3 |
|---|
| August | 40 | 4 |
|---|
| September | 35 | 5 |
|---|
| October | 50 | 6 |
|---|
| November | 25 | 5 |
|---|
| December | 20 | 5 |
|---|
| Year | 390 | 59 |
|---|
Best Time
The
best time to visit the Pyrenees and the valleys at the foot of the mountains is summer, since it is the warmest (or mildest) and sunniest period of the year.
In the areas at low altitude of central and southern Aragon (see Huesca, Zaragoza), since the summer is hot, you may prefer spring and autumn (although the rains are more frequent), especially in May, and from mid-September to mid-October.
Those who can stand the heat can choose July and August also in the center-south, but they should be ready to stroll around the cities in hot weather. Given the high temperature range, except perhaps in Zaragoza, also in the center-south, it's better to bring a sweatshirt for the evening even in summer.
Back to topSee also the
temperatures by month.