Select units of measurement for the temperature and rainfall tables (metric or imperial).
Average weather, temperature, rainfall, sunshine
The climate of Haiti is
tropical, hot throughout the year, with a less hot period from November to March, when the trade winds from the northeast prevail, and a muggy period from May to October, when the heat becomes unpleasant, though along the coasts it is tempered by the breeze. Temperatures are a bit higher in inland plains and on the south-facing coasts, while they are slightly lower along the north-facing coasts.
As regards to the
rainfall, there is usually a dry season from December to February and a rainy season from April to October, with two rainy peaks at the beginning and the end of the period, and a decrease in July.
As generally happens in tropical climates, the rains in Haiti occur mostly in the form of
short but intense showers or thunderstorms, which do not affect much the amount of sunshine, except perhaps in September and October, which are typically the rainiest months, and when the rains are more frequent and may last longer.
In fact, the amount of
sunshine in Haiti is good all year round, at least along the coasts.
From December to March, the north-west
cool wind, coming from the United States, can sometimes lower the temperature by a few degrees, bringing the night temperatures a few degrees below 20 °C (68 °F).
The
sea in Haiti is warm all year round: on the northern coast, the sea surface temperature ranges from 26 °C (79 °F) between February and April to 29 °C (84 °F) between July and October, while near Port-au-Prince, it is slightly warmer.
Haiti occupies the western part of the island of
Hispaniola, which is located in the Caribbean, southeast of Cuba and west of Puerto Rico.
The climate in detail
South side
Port-Au-Prince

The capital,
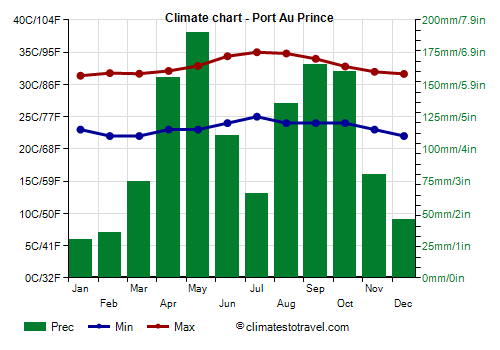
Port-Au-Prince, is located in a particularly warm and sheltered area, where the maximum temperatures are 34/35 °C (93/95 °F) from June to September. In fact, Port-Au-Prince is
the hottest city in the Caribbean.
In Port-au-Prince, a total of 1,250 millimeters (49 inches) of rain falls per year.
North coast
In other areas, there are
microclimates in which the rains follow a different pattern than that of Port-au-Prince. The
coasts exposed to the north (therefore, to the north-east trade winds) are
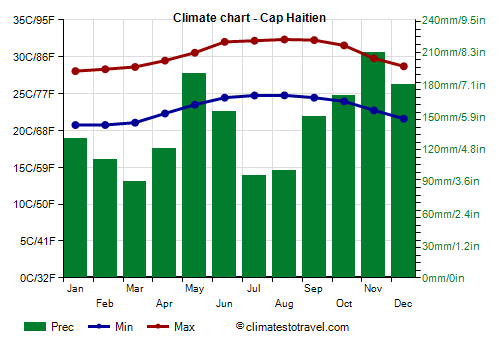
rainy even in winter, especially in the first part, in November and December. This happens on the northern coast (see Cap-Haïtien), and to a lesser extent on the north-facing coast of the Department of Grand Anse (see Jérémie).
Cap-Haïtien

In Cap-Haïtien, a total of 1,700 millimeters (67 inches) of rain falls per year. The wettest months are November and December, and there is no real dry period, therefore we can speak of
equatorial climate.
In Cap-Haïtien, the temperatures are a little lower than in Port-Au-Prince, since it is directly exposed to the north-east trade winds.
 Citadelle Laferrière
Moving inland, we find some
hills, and in the south, there are also some
mountains, among which the highest is
Pic la Selle, 2,680 meters (8,793 feet) high; in this area, there are also sheltered valleys and plains, which are almost arid, since precipitation drops below 1,000 mm (40 inches) per year.
Hurricanes
From June to November, in Haiti, as commonly happens in the Caribbean, it's the period of
hurricanes, which, though rarely directly hit a particular location, are dangerous and may sometimes be destructive. However, hurricanes are most likely from August to October.
The country was hit hard by the "Dominican Republic hurricane" in September 1930, by the "Jérémie hurricane" in October 1935, by Hurricane Flora in early October 1963, by hurricane Georges in September 1998, and by hurricane Matthew in October 2016.
However, tropical storms, even when they are not very intense, can still cause heavy rainfall in inland mountainous areas, and given the fragility of the soil, they may cause landslides and floods.
When to go
The best time to visit
the capital and the south-central area of Haiti is from December to March.
On the
northern coast, given the frequent rains lingering until December, you can choose January, February and March.
Winter is warm enough for a beach holiday, even though Haiti is not a quiet country in socio-economic terms, and it's not equipped for this type of activity.
In
summer, the sun frequently shines, but the heat is sweltering, and there is some risk of hurricanes. In this period, the best month (or the least bad) is July because there's usually a certain decrease in rainfall (also in the northern coasts), furthermore, hurricanes are less likely than in August and September.
What to pack
From
November to April: bring light clothes, and a sweatshirt for the evening. When going to the mountains, bring a jacket and hiking boots.
From
May to October, bring lightweight clothing, and possibly a light sweatshirt and a light raincoat for thunderstorms. When going to the mountains, bring a sweatshirt or a sweater.
Climate data - Haiti
| Cap Haitien |
|---|
|
| Jan | Feb | Mar | Apr | May | Jun | Jul | Aug | Sep | Oct | Nov | Dec |
|---|
| Min temp. | 21 | 21 | 21 | 22 | 24 | 24 | 25 | 25 | 24 | 24 | 23 | 22 |
|---|
| Max temp. | 28 | 28 | 29 | 29 | 31 | 32 | 32 | 32 | 32 | 32 | 30 | 29 |
|---|
| Precip. | 130 | 110 | 90 | 120 | 190 | 155 | 95 | 100 | 150 | 170 | 210 | 180 |
|---|
| Prec. days | 10 | 8 | 9 | 9 | 12 | 12 | 14 | 14 | 15 | 16 | 12 | 11 |
|---|
|
|
|
|
| Port-au-Prince |
|---|
|
| Jan | Feb | Mar | Apr | May | Jun | Jul | Aug | Sep | Oct | Nov | Dec |
|---|
| Min temp. | 23 | 22 | 22 | 23 | 23 | 24 | 25 | 24 | 24 | 24 | 23 | 22 |
|---|
| Max temp. | 31 | 32 | 32 | 32 | 33 | 34 | 35 | 35 | 34 | 33 | 32 | 32 |
|---|
| Precip. | 30 | 35 | 75 | 155 | 190 | 110 | 65 | 135 | 165 | 160 | 80 | 45 |
|---|
| Prec. days | 3 | 5 | 7 | 11 | 13 | 8 | 7 | 11 | 12 | 12 | 7 | 3 |
|---|
|
|
| Sun hours | 8 | 8 | 9 | 8 | 8 | 8 | 9 | 9 | 8 | 8 | 8 | 8 |
|---|
| Sea temp | 27 | 27 | 27 | 27 | 28 | 28 | 29 | 29 | 29 | 29 | 29 | 28 |
|---|