Select units of measurement for the temperature and rainfall tables (metric or imperial).
Average weather, temperature, rainfall, sunshine hours

Paramaribo's climate is
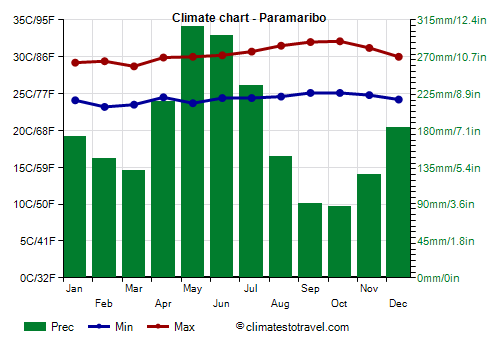
equatorial, hot, humid and rainy all year round. However, even though there is no dry season, the rains decrease from September to November. The wettest months are May and June.
The city is the capital of Suriname and is located in the north of the country, on the banks of the Suriname River, near the coast of the Atlantic Ocean, at almost 6 degrees north latitude.
Paramaribo - Climate data
In Paramaribo, the
average temperature of the coldest month (March) is of
26.1 °C, that of the warmest month (October) is of
28.6 °C. Here are the average temperatures.
Paramaribo - Average temperatures (1991-2020) |
| Month | Min | Max | Mean |
|---|
| January | 24.1 | 29.2 | 26.6 |
|---|
| February | 23.2 | 29.4 | 26.3 |
|---|
| March | 23.5 | 28.7 | 26.1 |
|---|
| April | 24.5 | 29.9 | 27.2 |
|---|
| May | 23.7 | 30 | 26.8 |
|---|
| June | 24.4 | 30.2 | 27.3 |
|---|
| July | 24.4 | 30.7 | 27.6 |
|---|
| August | 24.6 | 31.5 | 28 |
|---|
| September | 25.1 | 32 | 28.6 |
|---|
| October | 25.1 | 32.1 | 28.6 |
|---|
| November | 24.8 | 31.2 | 28 |
|---|
| December | 24.2 | 30 | 27.1 |
|---|
| Year | 24.3 | 30.4 | 27.3 |
|---|
amounts to
2135 millimeters per year: it is therefore abundant. It ranges from
86.5 millimeters in the driest month (October) to
306.6 millimeters in the wettest one (May). Here is the average precipitation.
Paramaribo - Average precipitation| Month | Days |
|---|
| January | 173 | |
|---|
| February | 146 | |
|---|
| March | 130 | |
|---|
| April | 216 | |
|---|
| May | 307 | |
|---|
| June | 296 | |
|---|
| July | 234 | |
|---|
| August | 148 | |
|---|
| September | 90 | |
|---|
| October | 86 | |
|---|
| November | 126 | |
|---|
| December | 184 | |
|---|
| Year | 2135 | |
|---|
The
sea temperature ranges from
26.5 °C in January, February to
28.5 °C in August, September. Here are the average sea temperatures.
Paramaribo - Sea temperature| Month |
|---|
| January | 26.5 |
|---|
| February | 26.5 |
|---|
| March | 27 |
|---|
| April | 27 |
|---|
| May | 27.5 |
|---|
| June | 28 |
|---|
| July | 28 |
|---|
| August | 28.5 |
|---|
| September | 28.5 |
|---|
| October | 28 |
|---|
| November | 28"> |
|---|
| December | 27.5 |
|---|
| Year | 27.6 |
|---|
There are on average around 2735
sunshine hours per year. Here are the average hours of sunshine per day.
Paramaribo - Sunshine hours| Month | Average | Total |
|---|
| January | 6 | 190 |
|---|
| February | 6.5 | 190 |
|---|
| March | 7 | 220 |
|---|
| April | 6.5 | 200 |
|---|
| May | 6 | 190 |
|---|
| June | 6.5 | 195 |
|---|
| July | 8 | 250 |
|---|
| August | 9 | 280 |
|---|
| September | 9.5 | 290 |
|---|
| October | 9.5 | 290 |
|---|
| November | 8 | 245 |
|---|
| December | 6 | 190 |
|---|
| Year | 7.5 | 2735 |
|---|