Select units of measurement for the temperature and rainfall tables (metric or imperial).
Average weather, temperature, rainfall, sunshine hours
Index
Introduction
In Catalonia, an autonomous community located in north-eastern Spain, there are different types of climate: the climate is Alpine (cold mountain climate) in the Pyrenees, on the border with France; it's oceanic (cool and wet) in the small area of the Garonne valley, located to the north of the Pyrenees; and it's Mediterranean along the coast, while in inland areas (see Lleida), it gets a little more continental and drier than the real Mediterranean climate.
Rainfall exceeds 1,000 millimeters (40 inches) per year in the Pyrenean area, where some rains and thunderstorms can occur also in summer, it remains above 700 mm (27.5 in) in the Girona province, it hovers around 600 mm (23.5 in) on the coast of Barcelona and around 500 mm (20 in) on the coast of Tarragona, while it drops below 400 mm (16 in) in the central and southern inland areas (see Lleida), which are definitely arid.
The amount of
sunshine in Catalonia is good on the coast and in inland south-central areas, while cloud cover is more frequent in the Pyrenean and the Atlantic area. In Girona, the average ranges from 4 hours of sunshine per day in December to 9 hours in July (for a total of 2,300 hours per year), in Barcelona and Tarragona from 4.5 hours in December to 10 in July (for a total of 2,500 hours per year), in Tortosa from 5 hours in December to 10.5 in July. In Lleida, lying in the interior, there are more often fogs and low clouds in winter, so much so that there are only 3 hours of sunshine per day in December, while summer is sunny as well, with as many as 11.5 sunshine hours in July, for a total of 2,700 hours per year.
The coasts
On the
coast, the climate is Mediterranean, with mild, relatively rainy winters and hot, sunny summers, during which the air is humid, but tempered by the breeze.
However, cold periods are possible in winter, especially in the northern part, where it can sometimes snow.
On the other hand, in summer, there can be very hot periods, which are more likely in the southern part (see Tarragona, Tortosa), with peaks of 40 °C (104 °F) and more, while the central-northern part of the coast up to Barcelona is quite sheltered from heat waves.
Costa Brava
The northernmost part of the coast, in the province of
Girona, is called
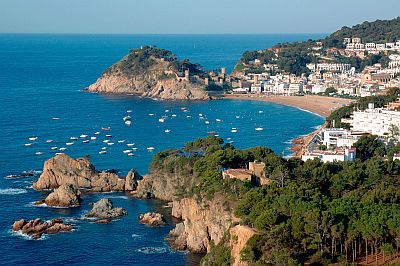
Costa Brava. There are towns such as Portbou, Colera, Llançà, Cadaqués, Roses, Sant Pere Pescador, L'Escala, Estartit, Begur, Palafrugell, Palamós, Platja d'Aro, Sant Feliu de Guixols, Tossa de Mar,
Lloret de Mar and Blanes.
Owing to its northern location, the climate is quite cold in winter, moreover, this part of the coast, more or less up to Sant Feliu de Guixos, is exposed to the north wind ("tramontana") when cold air from France reaches the Gulf of Lion.
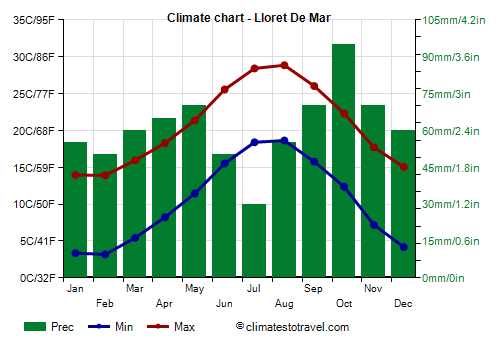
Here are the average temperatures in Lloret De Mar.
Lloret De Mar - Average temperatures (2008-2019) |
| Month | Min | Max | Mean |
|---|
| January | 3.4 | 14 | 8.7 |
|---|
| February | 3.2 | 13.9 | 8.6 |
|---|
| March | 5.4 | 16 | 10.7 |
|---|
| April | 8.2 | 18.3 | 13.3 |
|---|
| May | 11.5 | 21.4 | 16.4 |
|---|
| June | 15.5 | 25.6 | 20.5 |
|---|
| July | 18.4 | 28.4 | 23.4 |
|---|
| August | 18.6 | 28.8 | 23.7 |
|---|
| September | 15.8 | 26 | 20.9 |
|---|
| October | 12.4 | 22.3 | 17.3 |
|---|
| November | 7.2 | 17.7 | 12.5 |
|---|
| December | 4.2 | 15 | 9.6 |
|---|
| Year | 10.4 | 20.7 | 15.45 |
|---|
The rains have two maxima in spring and autumn, and a few disturbances may pass over the area even in summer.
Lloret De Mar - Average precipitation| Month | Days |
|---|
| January | 55 | 6 |
|---|
| February | 50 | 5 |
|---|
| March | 60 | 8 |
|---|
| April | 65 | 9 |
|---|
| May | 70 | 8 |
|---|
| June | 50 | 6 |
|---|
| July | 30 | 4 |
|---|
| August | 55 | 6 |
|---|
| September | 70 | 7 |
|---|
| October | 95 | 9 |
|---|
| November | 70 | 7 |
|---|
| December | 60 | 7 |
|---|
| Year | 730 | 82 |
|---|
The temperature of the
sea is lower in the northernmost part of the Costa Brava than in the central and southern part, in fact, beyond the French border, the Gulf of Lions receives cold Atlantic air masses for many months a year, which are able to cool down the sea. In Colera, near the French border, and in Rosas, in the
Gulf of Roses, the water temperature does not go over 22 °C (72 °F) in July and 23 °C (73 °F) in August.
Rosas - Sea temperature| Month |
|---|
| January | 13 |
|---|
| February | 12.5 |
|---|
| March | 13 |
|---|
| April | 14 |
|---|
| May | 16.5 |
|---|
| June | 19.5 |
|---|
| July | 22 |
|---|
| August | 23 |
|---|
| September | 21.5 |
|---|
| October | 19 |
|---|
| November | 16.5"> |
|---|
| December | 14 |
|---|
| Year | 17 |
|---|
Continuing to the south, the sea temperature increases slightly, but it remains cool enough down to Palamós and Sant Feliu de Guíxols.
In the southernmost part of the Costa Brava (see Tossa de Mar, Lloret de Mar, Blanes), the sea is a bit warmer, where the water temperature reaches 23 °C (73.5 °F) in July and September and 25 °C (77 °F) in August.
Lloret De Mar - Sea temperature| Month |
|---|
| January | 13.5 |
|---|
| February | 13 |
|---|
| March | 13.5 |
|---|
| April | 14.5 |
|---|
| May | 17 |
|---|
| June | 20.5 |
|---|
| July | 23.5 |
|---|
| August | 25 |
|---|
| September | 23.5 |
|---|
| October | 21 |
|---|
| November | 17.5"> |
|---|
| December | 15 |
|---|
| Year | 18.3 |
|---|
In the central-southern part of the coast of Catalonia, in the provinces of Barcelona and Tarragona, the sea temperature is similar to that of Blanes, or it is, albeit slightly, even higher.
Costa de Barcelona
South of Costa Brava, in the province of Barcelona, we find the
Costa de Barcelona, which includes towns like Sitges, Vilanova i la Geltru, Arenys de Mar, Malgrat de Mar, Santa Susanna, Calella, Castelldefels, Badalona, Mataro, Sant Pol de Mar, and Canet de Mar.
In
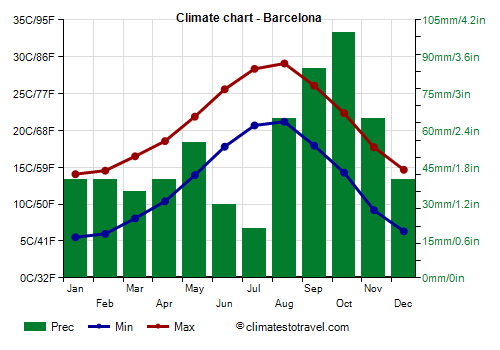
Barcelona, the regional capital, the average temperature ranges from 10 °C (50 °F) in January to 25 °C (77 °F) in August.
Barcelona - Average temperatures (1991-2020) |
| Month | Min | Max | Mean |
|---|
| January | 5.5 | 14.1 | 9.8 |
|---|
| February | 6 | 14.6 | 10.3 |
|---|
| March | 8.1 | 16.5 | 12.3 |
|---|
| April | 10.4 | 18.6 | 14.5 |
|---|
| May | 13.9 | 21.9 | 17.9 |
|---|
| June | 17.8 | 25.6 | 21.7 |
|---|
| July | 20.7 | 28.4 | 24.5 |
|---|
| August | 21.2 | 29.1 | 25.1 |
|---|
| September | 18 | 26.1 | 22 |
|---|
| October | 14.3 | 22.4 | 18.3 |
|---|
| November | 9.2 | 17.7 | 13.5 |
|---|
| December | 6.3 | 14.7 | 10.5 |
|---|
| Year | 12.7 | 20.8 | 16.7 |
|---|
In Barcelona, precipitation amounts to 620 mm (24.5 in) per year, with an evident maximum in autumn due to the prevailing southern currents. In winter, the rains are not abundant: only 40 mm (1.6 in) per month from December to February.
Barcelona - Average precipitation| Month | Days |
|---|
| January | 40 | 4 |
|---|
| February | 40 | 4 |
|---|
| March | 35 | 5 |
|---|
| April | 40 | 5 |
|---|
| May | 55 | 5 |
|---|
| June | 30 | 4 |
|---|
| July | 20 | 2 |
|---|
| August | 65 | 5 |
|---|
| September | 85 | 5 |
|---|
| October | 100 | 7 |
|---|
| November | 65 | 5 |
|---|
| December | 40 | 5 |
|---|
| Year | 620 | 56 |
|---|
In Barcelona, the
sea is warm enough for swimming from July to September, with a peak in August of 25 °C (77 °F). In June, the sea is still cool, around 20 °C (68 °F).
Barcelona - Sunshine hours| Month | Average | Total |
|---|
| January | 5 | 150 |
|---|
| February | 6 | 165 |
|---|
| March | 6.5 | 200 |
|---|
| April | 7.5 | 220 |
|---|
| May | 8 | 245 |
|---|
| June | 8.5 | 260 |
|---|
| July | 10 | 310 |
|---|
| August | 9 | 280 |
|---|
| September | 7.5 | 220 |
|---|
| October | 6 | 180 |
|---|
| November | 5 | 145 |
|---|
| December | 4.5 | 140 |
|---|
| Year | 6.9 | 2515 |
|---|
Costa Dorada
Further south, in the province of
Tarragona, we find the
Costa Dorada, which includes towns like L'Espluga de Francoli, Salou, Tarragona,
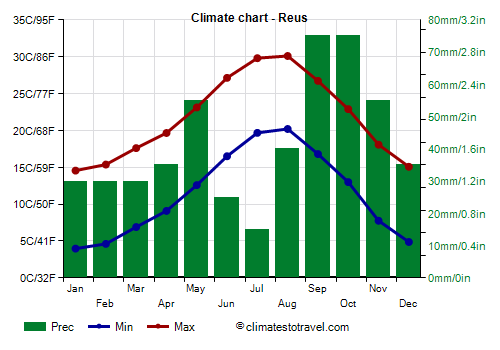
Reus, Valls, Mont-Roig del Camp, Montblanc, Prades, Altafulla, and Calafell. Here, the climate is Mediterranean, similar to that of the coast of Barcelona, though a bit drier.
For instance, in Reus, 500 mm (20 in) of rain fall per year; even here, you can notice the peak in autumn, while in winter, it rains little.
Reus - Average precipitation| Month | Days |
|---|
| January | 30 | 4 |
|---|
| February | 30 | 4 |
|---|
| March | 30 | 4 |
|---|
| April | 35 | 5 |
|---|
| May | 55 | 5 |
|---|
| June | 25 | 3 |
|---|
| July | 15 | 2 |
|---|
| August | 40 | 4 |
|---|
| September | 75 | 5 |
|---|
| October | 75 | 6 |
|---|
| November | 55 | 4 |
|---|
| December | 35 | 4 |
|---|
| Year | 500 | 50 |
|---|
In the Costa Dorada too, the
sea is warm enough for swimming from July to September, with a maximum in August of 25.5 °C (78 °F), while in June, it is still cool, around 21 °C (70 °F).
Reus - Sea temperature| Month |
|---|
| January | 14 |
|---|
| February | 13.5 |
|---|
| March | 13.5 |
|---|
| April | 15 |
|---|
| May | 17.5 |
|---|
| June | 21 |
|---|
| July | 24 |
|---|
| August | 25.5 |
|---|
| September | 24 |
|---|
| October | 21.5 |
|---|
| November | 18"> |
|---|
| December | 15.5 |
|---|
| Year | 18.6 |
|---|
The southernmost part of the Costa Dorada, south of Tarragona, is the mildest in winter, in fact, frosts become rare and snowfalls only occasional. However, the coastal stretch on the Gulf of San Jorge, from Cambrils to l'Ampolla, is the
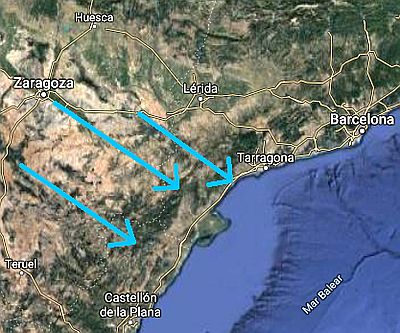
windiest of the Costa Dorada, because it can receive the wind from the north-west, the Cierzo, which mainly blows in the cold half of the year, and in other parts of the coast is stopped by the mountains.
This wind comes from the
Ebro valley, in Aragon, where Zaragoza is located. The Ebro, the longest river in Spain, finds its way through the mountains and flows into the sea in southern Catalonia after crossing
Tortosa. The Ebro Delta is protected in a natural park.
Inland areas
In the
interior of Catalonia, in the Catalan Central Depression, which is actually a plain area, formed by the Ebro River and its tributaries, the climate is slightly more continental and more arid.
Lleida
In
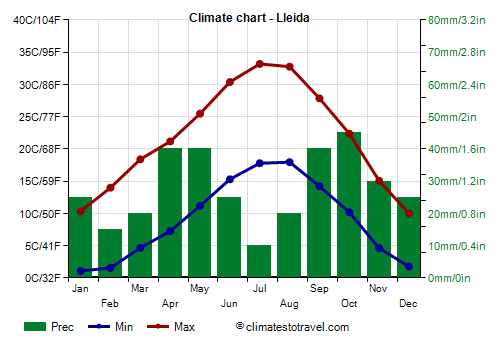
Lleida, the capital of the only landlocked province, the monthly average temperature ranges from 5.5 °C (42 °F) in January to 25.5 °C (78 °F) in July and August. In winter, nights are often cold, with possible slight frosts. In summer, scorching days are frequent, with peaks around 40 °C (104 °F), but the air is dry, and the temperature drops a lot at night.
Lleida - Average temperatures (1991-2020) |
| Month | Min | Max | Mean |
|---|
| January | 1.1 | 10.3 | 5.7 |
|---|
| February | 1.6 | 14 | 7.8 |
|---|
| March | 4.6 | 18.4 | 11.5 |
|---|
| April | 7.3 | 21.2 | 14.2 |
|---|
| May | 11.2 | 25.5 | 18.3 |
|---|
| June | 15.3 | 30.4 | 22.8 |
|---|
| July | 17.8 | 33.2 | 25.5 |
|---|
| August | 18 | 32.8 | 25.4 |
|---|
| September | 14.2 | 27.8 | 21 |
|---|
| October | 10.2 | 22.4 | 16.3 |
|---|
| November | 4.6 | 15.1 | 9.8 |
|---|
| December | 1.8 | 10 | 5.9 |
|---|
| Year | 9 | 21.8 | 15.35 |
|---|
In Lleida, only 340 mm (13.5 in) of rain fall per year. You can notice the considerably low amount of rainfall in winter.
Lleida - Average precipitation| Month | Days |
|---|
| January | 25 | 4 |
|---|
| February | 15 | 3 |
|---|
| March | 20 | 4 |
|---|
| April | 40 | 5 |
|---|
| May | 40 | 6 |
|---|
| June | 25 | 4 |
|---|
| July | 10 | 2 |
|---|
| August | 20 | 2 |
|---|
| September | 40 | 4 |
|---|
| October | 45 | 5 |
|---|
| November | 30 | 4 |
|---|
| December | 25 | 4 |
|---|
| Year | 340 | 46 |
|---|
There are also some mountain ranges parallel to the coast (the
Catalan Mediterranean System), where the climate gets colder with increasing altitude. In the Montseny Massif, located between the provinces of Barcelona and Girona, the highest point is
Turó de l'Home, 1,707 meters (5,600 feet) high. Here are the average temperatures.
Turó de l Home - Average temperatures (1991-2020) |
| Month | Min | Max | Mean |
|---|
| January | -1.2 | 4.2 | 1.5 |
|---|
| February | -1.8 | 4.3 | 1.3 |
|---|
| March | 0 | 6.6 | 3.3 |
|---|
| April | 1.7 | 8.4 | 5 |
|---|
| May | 5.4 | 12.4 | 8.9 |
|---|
| June | 9.5 | 16.9 | 13.2 |
|---|
| July | 12.2 | 20.1 | 16.2 |
|---|
| August | 12.4 | 20.2 | 16.3 |
|---|
| September | 8.7 | 15.4 | 12.1 |
|---|
| October | 5.6 | 11.6 | 8.6 |
|---|
| November | 1.7 | 7.2 | 4.5 |
|---|
| December | -0.3 | 5.2 | 2.4 |
|---|
| Year | 4.5 | 11.1 | 7.8 |
|---|
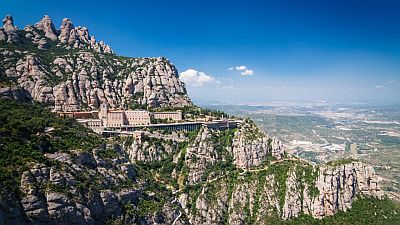
The range of Montserrat reaches 1,236 meters (4,055 feet), but the monastery is at 700 meters (2,300 feet).
In the valleys between these mountain ranges, fog can form in winter, while during cold spells from Eastern Europe, it can snow at an altitude above 300 meters (1,000 feet).
Further south, and northwest of Reus and Tarragona, we find the
Montañas de Prades, whose highest peak is Tossal de la Baltasana, 1,202 meters (3,943 ft) high. Further south, west of Tortosa, we find the
Ports de Beseit, a massif whose highest peak, Mount Caro, reaches 1,441 meters (4,727 ft) in height.
These mountains can be very windy when the north-west wind blows, which as we said can sometimes reach the coast, especially in a certain stretch.
In the far north, along the border with France, we find the chain of the
Pyrenees; the highest peak of Catalonia is
Pica d'Estats, 3,143 meters (10,312 feet) high, on the border with France. In the area at the foot of the Pyrenees, at the same altitude, the climate is cooler than in the south-central region; in addition, this area is exposed to outbreaks of cold air, with strong winds, in winter. At high altitudes, heavy snowfalls occur in winter. Summer is cool, with possible afternoon thunderstorms, but given the position, some Atlantic fronts can affect this area even in this season.
Here are the average temperatures in Boí Taüll, at 1,790 meters (5,870 ft) above sea level.
Boi Taull - Average temperatures (2008-2019) |
| Month | Min | Max | Mean |
|---|
| January | -7 | -0.5 | -3.8 |
|---|
| February | -8.8 | -1.6 | -5.2 |
|---|
| March | -6.5 | 1 | -2.7 |
|---|
| April | -3.8 | 3.9 | 0.1 |
|---|
| May | -0.6 | 6.3 | 2.8 |
|---|
| June | 4 | 10.4 | 7.2 |
|---|
| July | 7 | 13.8 | 10.4 |
|---|
| August | 7.2 | 13.9 | 10.6 |
|---|
| September | 3.8 | 9.9 | 6.8 |
|---|
| October | 1.1 | 6.8 | 3.9 |
|---|
| November | -4.3 | 1.3 | -1.5 |
|---|
| December | -5.1 | 1.1 | -2 |
|---|
| Year | -1 | 5.6 | 2.25 |
|---|
In the Pyrenean valleys too,
cold spells can occur in winter, with night frosts, while in periods of stable weather, cold and foggy days can occur. In summer, the temperatures are pleasantly warm during the day, but sometimes, days with scorching heat are possible, even though the air is dry and nights remain cool.
In February 1956, at Gento lake, at 2,150 meters (7,055 ft), with -32 ° C (-25.5 °F), the cold record of Catalonia and all of Spain was recorded. In January 2021, the record was broken, with -34 °C (-29 °F) in Clot del Tuc de la Llança, in a valley at 2,300 meters (7,545 ft), albeit in an unofficial weather station, and during a less intense cold spell than that of 1956.
Best Time
The
best time to visit the Pyrenees and the valleys at the foot of the mountains is summer, since it is the warmest (or mildest) and sunniest period of the year.
The summer, from mid-June to August, is also the best time for a beach holiday on the coasts of Catalonia.
In low-lying inland areas (see Lleida), being the summer hot, you may prefer spring and autumn, although the rains are more frequent, in particular, the month of May and from mid-September to mid-October.
Those who can stand the heat can choose July and August even in this area, but they should be ready to stroll around the cities in hot weather.
Back to topSee also the
temperatures by month.