Select units of measurement for the temperature and rainfall tables (metric or imperial).
Average weather, temperature, rainfall, sunshine hours

The climate of Lloret de Mar, located on the Costa Brava, is
Mediterranean, with mild, relatively rainy winters and hot, sunny summers.
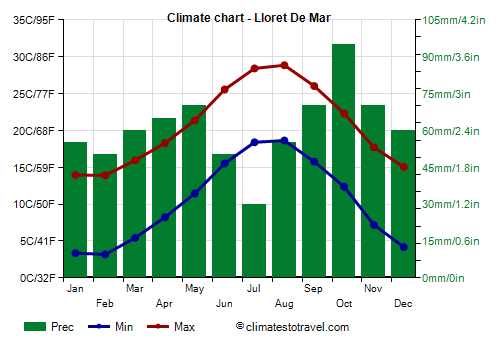
The Costa Brava is the northernmost part of the Mediterranean coast of Spain (and of Catalonia), up to the border with France. The proximity to the area of France where Atlantic depressions enter the Mediterranean Sea, makes it more rainy than other areas of the Spanish east coast: in an average year, more than 700 millimeters (27.5 inches) of rain fall.
Winter, from December to February, is mild, with sunny days, but also rainy periods. The average temperature in January is 8.5 °C (47.5 °F), so the winter is not as mild as in southern Spain. Sometimes, there can be cold periods, when cold air from eastern Europe arrives here, and occasionally, it may even snow. In February 2012, the temperature dropped to -7 °C (19.5 °F).
Spring, from March to May, is mild and quite sunny, sometimes a bit cold and rainy in March and April, while in May, the temperature becomes higher, and at the same time, some thunderstorms begin to erupt in the afternoon. Atlantic fronts pass more often in March and April, but sometimes also in May.
Summer, from June to August, is hot and sunny, with the breeze from the sea that tempers the heat. Sometimes, thunderstorms can develop in the interior, and then reach the coast. We cannot exclude that some Atlantic disturbances, able to bring a bit of rain, can affect this area also in this season, more likely in June and in the second half of August.
Autumn, from September to November, is pleasantly warm at the beginning, and then becomes gradually cooler. This is the wettest season of the year; October is usually the rainiest month.

The amount of
sunshine in Lloret de Mar is good in summer, when the weather is usually nice, and passable in spring, especially in April and May, and again in September. In the rest of the year, namely in autumn and winter, there is a moderate amount of sunny days, but they alternate with cloudy periods.
The temperature of the
sea, still very cool in June, reaches 25 °C (77 °F) in August, while in July, it is still around 23.5 °C (74 °F), so it's a little cooler, but overall acceptable for swimming.
Best Time
The
best time to go to Lloret de Mar for a beach holiday is the summer, from mid-June to August.
If you want to visit the Costa Brava and nearby towns like Girona, you can choose the months of May, June and September, in order to avoid the hottest months. However, it is useful to recall that it can sometimes rain because of weather disturbances, or in the form of afternoon thunderstorms.
Back to
Catalonia.
Lloret De Mar - Climate data
In Lloret De Mar, the
average temperature of the coldest month (February) is of
8.6 °C, that of the warmest month (August) is of
23.7 °C. Here are the average temperatures.
Lloret De Mar - Average temperatures (2008-2019) |
| Month | Min | Max | Mean |
|---|
| January | 3.4 | 14 | 8.7 |
|---|
| February | 3.2 | 13.9 | 8.6 |
|---|
| March | 5.4 | 16 | 10.7 |
|---|
| April | 8.2 | 18.3 | 13.3 |
|---|
| May | 11.5 | 21.4 | 16.4 |
|---|
| June | 15.5 | 25.6 | 20.5 |
|---|
| July | 18.4 | 28.4 | 23.4 |
|---|
| August | 18.6 | 28.8 | 23.7 |
|---|
| September | 15.8 | 26 | 20.9 |
|---|
| October | 12.4 | 22.3 | 17.3 |
|---|
| November | 7.2 | 17.7 | 12.5 |
|---|
| December | 4.2 | 15 | 9.6 |
|---|
| Year | 10.4 | 20.7 | 15.45 |
|---|
amounts to
730 millimeters per year: so, it is at an intermediate level. It ranges from
30 millimeters in the driest month (July) to
95 millimeters in the wettest one (October). Here is the average precipitation.
Lloret De Mar - Average precipitation| Month | Days |
|---|
| January | 55 | 6 |
|---|
| February | 50 | 5 |
|---|
| March | 60 | 8 |
|---|
| April | 65 | 9 |
|---|
| May | 70 | 8 |
|---|
| June | 50 | 6 |
|---|
| July | 30 | 4 |
|---|
| August | 55 | 6 |
|---|
| September | 70 | 7 |
|---|
| October | 95 | 9 |
|---|
| November | 70 | 7 |
|---|
| December | 60 | 7 |
|---|
| Year | 730 | 82 |
|---|
The
sea temperature ranges from
13 °C in February to
25 °C in August. Here are the average sea temperatures.
Lloret De Mar - Sea temperature| Month |
|---|
| January | 13.5 |
|---|
| February | 13 |
|---|
| March | 13.5 |
|---|
| April | 14.5 |
|---|
| May | 17 |
|---|
| June | 20.5 |
|---|
| July | 23.5 |
|---|
| August | 25 |
|---|
| September | 23.5 |
|---|
| October | 21 |
|---|
| November | 17.5"> |
|---|
| December | 15 |
|---|
| Year | 18.3 |
|---|
There are on average around 2490
sunshine hours per year. Here are the average hours of sunshine per day.
Lloret De Mar - Sunshine hours| Month | Average | Total |
|---|
| January | 5.5 | 165 |
|---|
| February | 5.5 | 160 |
|---|
| March | 6 | 185 |
|---|
| April | 6.5 | 200 |
|---|
| May | 7.5 | 230 |
|---|
| June | 8.5 | 255 |
|---|
| July | 10 | 310 |
|---|
| August | 9 | 275 |
|---|
| September | 7 | 205 |
|---|
| October | 6 | 190 |
|---|
| November | 5.5 | 165 |
|---|
| December | 5 | 155 |
|---|
| Year | 6.8 | 2490 |
|---|