Select units of measurement for the temperature and rainfall tables (metric or imperial).
Average weather, temperature, rainfall, sunshine
The climate in Costa Rica, a Central American country extending from 8 to 11 degrees north latitude, is
tropical, hot all year round, in the plains and along the coasts, while it's milder on the plateau, that is, in the so-called
tierras templadas.
Temperature variations are low because the country is located near the Equator, so the main difference between the seasons is found in the
rains. Anyway, most of the country is so rainy that it is covered with rainforests.
On the Pacific coast and the plateau, there are a
dry season from December to April and a
rainy season from May to November, during which rainfall is abundant. In contrast, in the eastern plains and coasts (but also in the southernmost part of the Pacific coast) the climate is equatorial, with abundant rainfall throughout the year.
The
sea is warm all year round on both coasts.
The climate in detail
Caribbean coast
The
east coast and the plain overlooking the Caribbean Sea are rain-soaked, and receive more than 3,000 millimeters (120 inches) per year; here the climate can be defined as
equatorial, that is, with no dry season. This happens because the north-east trade winds, which blow from November to April, directly hit this area. However, there are two peaks, in July and December, both with about 440 mm (17.5 in) of rain per month, and two relative minima in September-October and February-March, both with about 150/200 mm (6/8 in) per month. In this area, December is even the wettest month, and January is wetter than February and March. South of this coast, on the mountain slopes of the
Braulio Carrillo National Park, precipitation reaches up to 5 meters (16.5 feet) per year!
Puerto Limón
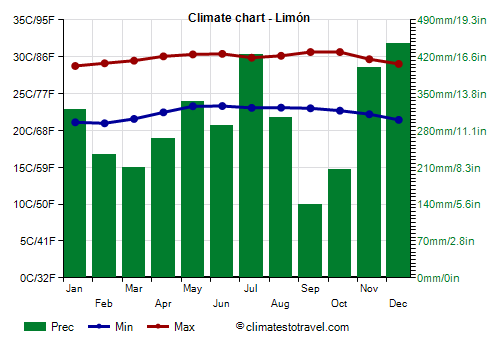
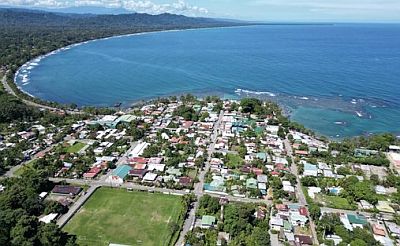
Along the coast of the Caribbean Sea, the weather is hot and humid all year round, since the winds blow constantly from the sea, however, the temperatures are slightly lower from December to February.
In
Puerto Limón, at 10 degrees north latitude, the maximum temperatures range from 29 °C (84 °F) in January and February, to 30.5 °C (87 °F) in September and October.
Here, 3,500 mm (140 in) of rain fall per year.
The sun on the east coast does not shine very often, as cloudy and rainy days are frequent all year round.
The
sea in Puerto Limón and on the coast of the Caribbean Sea is warm all year round.
Pacific coast
The
Pacific coast is slightly warmer than the Caribbean coast, especially in winter, when the north-east trade winds descend from the mountains and become hot and dry: the average daytime temperatures are around 30/32 °C (86/90 °F) in the least hot period, in October and November, while they can reach 34/35 °C (93/95 °F) in March and April, before the rainy season.
Here, there is a
well-defined dry season from December to April, at least in the central-northern part, while going south, the dry season becomes progressively shorter (it rains fairly often even in December and April), and in the southernmost part the climate is even equatorial, like on the coast of the Caribbean Sea.
The
north-central part (province of Guanacaste, canton of Puntarenas) is particularly hot from February to April, before the rains. In
inland areas, the heat is even more intense than on the coast, for example, in Liberia, the average maximum in April is 36 °C (97 °F). Moreover, this is the least rainy area of the country, with average rainfall around 1,300/1,600 mm (51/63 in) per year and savanna-like vegetation.
Puntarenas
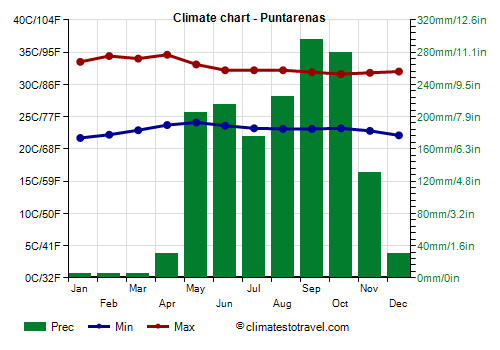
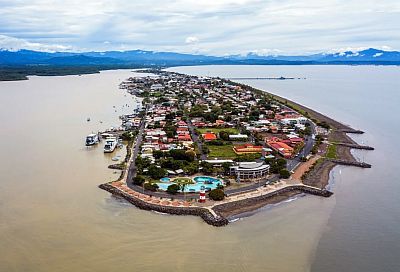
In Puntarenas, located in the north-central part of the Pacific Coast, the heat is intense throughout the year, and from February to April, the maximum average exceeds 34 °C (93 °F).
On average, 1,600 mm (63 in) of rain fall per year, with a rainy season from May to November and a dry season from December to April.
In Puntarenas, the sun shines regularly in the dry season, while in the rainy season it shines for an average of about 5 hours a day.
Quepos
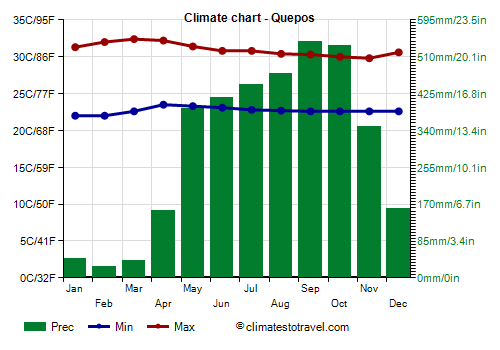
Further to the south, the Pacific Coast becomes more rainy, but in return, it is less hot, especially in spring. In
Quepos (formerly Aguirre), located on the coast, south of San José, 3,500 mm (140 in) of rain fall per year; as you can see, the rains are very abundant from May to November, but even in April and December, they still amount to around 150 mm (6 in).
Near Quepos we find the
Manuel Antonio National Park.
Further south, in the Osa peninsula and in the Golfo Dulce, it rains even more: in
Golfito, 4,100 mm (161 in) of rain fall per year, and there is no real dry season, even though the rainfall drops to around 100 mm (4 in) per month from January to March. In the Corcovado National Park, a tropical rainforest is found.
On the
Cocos Island, which is located in the Pacific Ocean, far to the south of the continent, the climate is equatorial as well.
Hills and mountains
In inland areas, between the two coasts, we find two mountain ranges, the
Cordillera Central and the
Cordillera de Talamanca.
San José
The capital city,
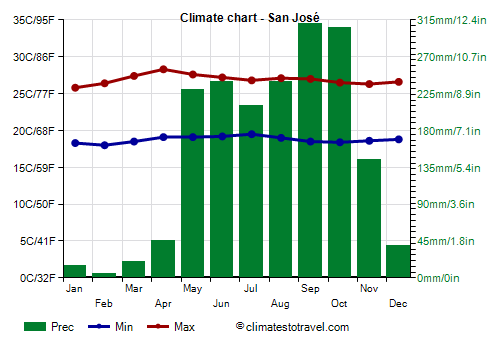
San José, is located in the central part, on the plateau that separates the two Cordilleras, at 1,100 meters (3,600 feet) above sea level, and therefore in the so-called
Tierras templadas, thus it has pleasant temperatures throughout the year, with cool nights and warm days.
At Tobías Bolaños International Airport, located at 995 meters (3,264 feet) above sea level, daytime temperatures reach 28 °C (82.5 °F) in April, the last month of the dry season.
In San José, there is little rain from December to March, and it almost never rains in January and February. The rainy season runs from May to November, and the wettest months are September and October, with around 300 millimeters (12 inches) per month.
The sun frequently shines in the dry season, while it does not shine very often in the rainy season, when the sky is often cloudy.
At
high altitudes, in the so-called
tierras frìas, above 2,000 meters (6,600 feet), the temperatures are low, especially in the winter months, and even more so on the slopes of the highest mountains and volcanoes, such as
Cerro Chirripó, 3,820 meters (12,532 feet) high, or
Irazú volcano, 3,431 meters (11,257 feet) high. Above 3,500 meters (11,500 ft), at night, it can freeze throughout the year.
Hurricanes
Costa Rica is almost always spared by the
hurricanes of the Caribbean Sea, whose path is usually located to the north of the country; in fact, sometimes they can affect nearby Nicaragua. Consequently, the area most at risk is the northern one, which may sometimes be affected by them, maybe indirectly. The hurricane season runs from June to November (though they are most likely in October and November), that is, during the rainy season, which in any case is generally not recommended for a holiday.
The first hurricane to hit directly Costa Rica was Otto in November 2016, although Hurricane Nate, which formed on the sea to the east of the country in October 2017 and then moved north, has brought even more serious damage.
There are also depressions and tropical storms which can be formed on the Pacific. They are usually not intense because they affect the country in the early stages of their formation, and then move northwestward without making landfall; however, they can still bring heavy rains, which can cause landslides and floods.
When to go
The best time to visit Costa Rica, either for a beach holiday or for exploring the rich nature of the country, runs from
January to mid-April, and in particular the months of February and March. In the lowlands, it's hot, the sun shines and there is little rain, except on the east coast, which is rainy throughout the year.
The capital, San José, can also be visited in December.
In the north-west (province of Guanacaste, canton of Puntarenas), where in December it rains already little, while the spring is very hot, you may prefer December and January.
In the south-west (southern part of the province of Puntarenas, see Quepos and Golfito, and Osa Peninsula), where in December it still rains quite frequently, you can go from January to mid-April.
On the Caribbean coast you can go in February and March.
What to pack
For San José and the
tierras templadas: all year round, bring light clothing, a sweatshirt or sweater for the evening; a raincoat or umbrella from May to November.
For plains and coasts: bring lightweight clothes; in the rainy season, you can add a light sweatshirt and a light raincoat for thunderstorms.
For the high mountains: bring warm clothes, a jacket, hiking boots.
Climate data - Costa Rica
| Liberia |
|---|
|
| Jan | Feb | Mar | Apr | May | Jun | Jul | Aug | Sep | Oct | Nov | Dec |
|---|
| Min temp. | 21 | 22 | 22 | 23 | 24 | 23 | 23 | 23 | 23 | 23 | 22 | 21 |
|---|
| Max temp. | 33 | 34 | 35 | 36 | 34 | 32 | 33 | 33 | 32 | 31 | 32 | 33 |
|---|
| Precip. | 0 | 0 | 5 | 25 | 195 | 245 | 155 | 210 | 345 | 310 | 100 | 10 |
|---|
| Prec. days | 0 | 0 | 0 | 1 | 9 | 14 | 10 | 12 | 17 | 16 | 6 | 2 |
|---|
|
|
| Sun hours | 10 | 10 | 10 | 9 | 7 | 6 | 6 | 6 | 5 | 6 | 7 | 8 |
|---|
|
| Limón |
|---|
|
| Jan | Feb | Mar | Apr | May | Jun | Jul | Aug | Sep | Oct | Nov | Dec |
|---|
| Min temp. | 21 | 21 | 22 | 22 | 23 | 23 | 23 | 23 | 23 | 23 | 22 | 21 |
|---|
| Max temp. | 29 | 29 | 29 | 30 | 30 | 30 | 30 | 30 | 31 | 31 | 30 | 29 |
|---|
| Precip. | 320 | 235 | 210 | 265 | 335 | 290 | 425 | 305 | 140 | 205 | 400 | 445 |
|---|
| Prec. days | 17 | 14 | 14 | 14 | 16 | 16 | 20 | 16 | 11 | 13 | 17 | 18 |
|---|
|
|
| Sun hours | 5 | 5 | 6 | 6 | 5 | 4 | 4 | 5 | 5 | 5 | 4 | 5 |
|---|
| Sea temp | 28 | 28 | 28 | 29 | 29 | 29 | 28 | 29 | 29 | 29 | 28 | 28 |
|---|
| Puntarenas |
|---|
|
| Jan | Feb | Mar | Apr | May | Jun | Jul | Aug | Sep | Oct | Nov | Dec |
|---|
| Min temp. | 22 | 22 | 23 | 24 | 24 | 24 | 23 | 23 | 23 | 23 | 23 | 22 |
|---|
| Max temp. | 34 | 34 | 34 | 35 | 33 | 32 | 32 | 32 | 32 | 32 | 32 | 32 |
|---|
| Precip. | 5 | 5 | 5 | 30 | 205 | 215 | 175 | 225 | 295 | 280 | 130 | 30 |
|---|
| Prec. days | 2 | 2 | 3 | 8 | 19 | 21 | 18 | 22 | 24 | 24 | 15 | 6 |
|---|
|
|
| Sun hours | 8 | 9 | 9 | 8 | 6 | 5 | 5 | 6 | 5 | 5 | 6 | 8 |
|---|
| Sea temp | 28 | 29 | 29 | 30 | 29 | 29 | 29 | 29 | 29 | 28 | 28 | 28 |
|---|
| Quepos |
|---|
|
| Jan | Feb | Mar | Apr | May | Jun | Jul | Aug | Sep | Oct | Nov | Dec |
|---|
| Min temp. | 22 | 22 | 23 | 24 | 23 | 23 | 23 | 23 | 23 | 23 | 23 | 23 |
|---|
| Max temp. | 31 | 32 | 32 | 32 | 31 | 31 | 31 | 30 | 30 | 30 | 30 | 31 |
|---|
| Precip. | 45 | 25 | 40 | 155 | 390 | 415 | 445 | 470 | 545 | 535 | 350 | 160 |
|---|
| Prec. days | 7 | 4 | 5 | 12 | 23 | 24 | 26 | 26 | 27 | 27 | 23 | 15 |
|---|
|
|
| Sun hours | 7 | 8 | 8 | 8 | 7 | 6 | 6 | 6 | 6 | 6 | 6 | 6 |
|---|
| Sea temp | 28 | 29 | 29 | 30 | 29 | 29 | 29 | 29 | 29 | 28 | 28 | 28 |
|---|
| San José (995 meters) |
|---|
|
| Jan | Feb | Mar | Apr | May | Jun | Jul | Aug | Sep | Oct | Nov | Dec |
|---|
| Min temp. | 18 | 18 | 18 | 19 | 19 | 19 | 20 | 19 | 18 | 18 | 19 | 19 |
|---|
| Max temp. | 26 | 26 | 27 | 28 | 28 | 27 | 27 | 27 | 27 | 26 | 26 | 27 |
|---|
| Precip. | 15 | 5 | 20 | 45 | 230 | 240 | 210 | 240 | 310 | 305 | 145 | 40 |
|---|
| Prec. days | 2 | 0 | 2 | 5 | 17 | 20 | 20 | 21 | 22 | 22 | 13 | 4 |
|---|
|
|
| Sun hours | 7 | 8 | 8 | 7 | 5 | 4 | 4 | 4 | 4 | 4 | 5 | 6 |
|---|
|
See also the
temperatures month by month