Select units of measurement for the temperature and rainfall tables (metric or imperial).
Average weather, temperature, rainfall, sunshine
The Dominican Republic, the eastern part of the island of Hispaniola, has a
tropical climate, hot all year round, with a hotter and muggy season from May to October and a relatively cool season from December to March, while November and April are intermediate months.
Along the eastern and southern coasts, there is a
rainy season between late April and October, while the northern coast, exposed to the trade winds, is rainy throughout the year, although the north-western coast experiences a decrease in rainfall from June to September.
Temperatures in the Dominican Republic are high throughout the year, at least in the plains, however, during the summer season, from May to October, the heat is sweltering, while it is more pleasant, but still a bit humid, in winter.
Because of the north-east
trade winds, which blow from November to March, the north facing slopes are usually wetter than those exposed to the south. However, the presence of
mountain ranges can increase or decrease the effect of the trade winds, so much so that some areas have a very humid climate and a lush vegetation, while others are nearly barren.
As a result,
rainfall varies greatly from area to area. For example in Azua, on the coast of the Ocoa Bay, only 640 millimeters (25 inches) of rain fall per year, and even less at Lake Enriquillo, closed between the two Sierras. The south-west coast of the Pedernales province is quite arid as well. On the contrary, in Santo Domingo, which lies on the southern coast but it's not protected by mountains, rainfall amounts to about 1,450 mm (57 in) per year.

In the Dominican Republic, as generally happens in the Caribbean, the rains occur mainly as short showers and thunderstorms, sometimes intense, which therefore do not reduce the
sunshine hours by much; moreover they are often concentrated in certain periods, so it might not rain for an entire week even in the rainy season.
Every now and then, from December to March, the country can be affected by some frontal systems from the United States, which can bring clouds and rains, and also a
cool wind, able to lower the temperature by a few degrees, although in a less noticeable way than in Cuba and Yucatan (Mexico), which are closer to the American continent.
However, in these cases, the temperature can drop below 10 °C (50 °F) in the inland hilly areas, and around freezing in the mountains.
The climate in detail
North coast
As mentioned, on the north coast, exposed to the north-east trade winds,
it rains even in winter.
In the central-western part (see San Fernando de Monte Cristi, Luperón, and the Amber Coast), the rains follow a particular pattern, opposite to the one typical of the Caribbean, in fact, the least rainy season is summer, from June to September (although this does not happen every year), while the winter season, when the north-east trade winds blow, is rainy.
The westernmost part, near the border with Haiti (see San Fernando de Monte Cristi) is almost arid, since it receives just 600 mm (23.5 in) of rain per year.
Puerto Plata
 Puerto Plata, where is located

In San Felipe de Puerto Plata, on the so-called Amber Coast, the average temperature ranges from 24.5 °C (76 °F) in January and February, to 28.5 °C (83 °F) from July to September.
The wettest months are even November and December, ie the first months when the trade winds blow, while from June to September, the rains are not abundant.
In Puerto Plata, the sun frequently shines for most of the year, but it does not shine as often as on the southern coast, especially in the months when the trade winds blow.
Sabana de la Mar
 Sabana de la Mar, where is located

Further to the east, in the
Samaná peninsula (see Sánchez, Samaná), the summer is rainy as well, so, since there is no dry season, we can speak of
equatorial climate.
In
Sabana de la Mar, located in the same area, in the south of the peninsula, 2,300 mm (90 in) of rain fall per year, with a minimum of 100/110 mm (3.9/4.3 in) per month in February and March.
South coast
On the southern coast, temperatures are a bit higher in winter, as the aforementioned north-east trade winds come from the interior and not directly from the sea.
There is usually a
rainy period from May to October, but there are areas where rainfall decreases in July and August, and goes under 100 mm (4 in) per month. In addition, in the south-west, there are also
semi-arid zones, where rainfall drops below 1,000 mm (40 in) per year, and sometimes, it even reaches 500 mm (20 in).
Barahona
 Barahona, where is located

For example, in
Barahona, where 1,000 mm (40 in) of rain fall per year, in July and August, i.e. between the two wettest periods (May-June and September-October), there is a clear decrease, and the rainfall drops to 40 mm (1.5 in) in July.
In Barahona, as generally happens on the southern coast, the maximum temperatures reach 30 °C (86 °F) even in winter.
Santo Domingo
 Santo Domingo, where is located

The capital, Santo Domingo, is located in the central part of the south coast. Here, the wettest period is the hottest, from May to October, as normally happens in the Caribbean.
Here too, daytime temperatures reach 30 °C (86 °F) even in January and February.
In Santo Domingo, the sun frequently shines all year round.
Punta Cana
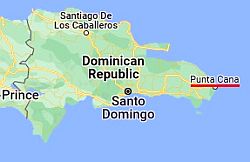 Punta Cana, where is located

On the easternmost tip of the Dominican Republic, we find
Punta Cana. Here, the temperatures are fairly uniform, but here too, there is a cooler period from December to March, and a hot and muggy period from May to October.
Rainfall amounts to 1,100 mm (43 in) per year, so the rainfall is not very abundant. The rains from May to December are fairly constant and not very abundant.
In Punta Cana too, the sun frequently shines all year round.

Sea temperature
In the Dominican Republic, the
sea is warm enough to swim in throughout the year: the water temperature ranges from 26.5 °C (79.5 °F) from January to March to 29 °C (84 °F) in September and October.
Hills and mountains
In the
mountainous areas, of course, the temperature decreases with altitude.
Constanza
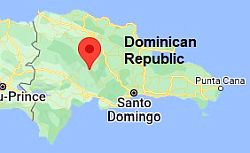 Constanza, where is located

In Constanza, 1,200 meters (4,000 feet) above sea level, winter nights are cool, in fact, the average low temperature in January is 9 °C (48 °F), and it can sometimes get cold and approach freezing (0 °C or 32 °F), but during the day, the weather is pleasantly warm, around 23 °C (73 °F), while in summer, the temperatures are slightly higher.
In Constanza there is no real dry season, however, from January to March, less than 100 mm (4 in) of rain fall per month.
If you want to climb the
Cordillera Central, maybe up to
Pico Duarte, which exceeds 3,000 meters (10,000 ft), remember that the temperature decreases by an average of about 6 degrees Celsius every 1,000 meters (3.3 °F every 1,000 feet).
Hurricanes
From June to November, the Dominican Republic can be affected by
hurricanes, the tropical cyclones of the Atlantic and the Caribbean, which, however, are most likely between August and October. The destructive Category 4 or 5 hurricanes are very rare, but when they directly hit a particular area, they can cause considerable damage. Tropical storms, less intense than cyclones, are more frequent and on average hit the country once every two years.
The country was hit hard by the "Dominican Republic hurricane" in September 1930, by hurricane David on August 31, 1979, and by hurricane Georges in September 1998.
In any case, tropical storms can produce heavy rains in inland mountainous areas even if they are not intense, causing landslides and floods.
When to go
The best time to visit the Dominican Republic is the
dry season, which however is not the same everywhere.
In the inland valleys and along the south coast (see Santo Domingo, Punta Cana), the best period is from
December to mid-April.
On the northern coast, especially in the areas in which there is no real dry season (province of Samaná, Sabana de la Mar), you can choose
February and March, which are the least rainy months.
In
summer, the weather is hot and sultry, and there's the danger of hurricanes. However, if you want to go in summer, there are several areas where it does not rain a lot, in particular, the
north-western coast, from the Haitian border to the Amber Coast (where the least rainy season is the period from June to September), the
south-west coast, and the part of the
south coast to the east of Santo Domingo (up to Punta Cana). In June and July, the likelihood of hurricanes is lower than in August.
What to pack
From
November to April: bring light clothes, a sun hat, sunscreen, and a sweatshirt for the evening. For the mountains, a jacket, a sweater, and hiking boots.
From
May to October, bring lightweight clothing, and possibly a light sweatshirt and a light raincoat for thunderstorms. For the mountains, a jacket, a sweatshirt, and hiking boots.
Climate data - Dominican Republic
| Barahona |
|---|
|
| Jan | Feb | Mar | Apr | May | Jun | Jul | Aug | Sep | Oct | Nov | Dec |
|---|
| Min temp. | 20 | 21 | 22 | 23 | 24 | 24 | 24 | 24 | 24 | 23 | 22 | 21 |
|---|
| Max temp. | 30 | 30 | 30 | 31 | 31 | 32 | 33 | 33 | 32 | 32 | 31 | 31 |
|---|
| Precip. | 30 | 30 | 45 | 65 | 170 | 130 | 40 | 65 | 145 | 185 | 75 | 45 |
|---|
| Prec. days | 4 | 3 | 4 | 6 | 11 | 8 | 4 | 5 | 9 | 11 | 5 | 2 |
|---|
|
|
| Sun hours | 8 | 9 | 9 | 9 | 8 | 9 | 9 | 9 | 8 | 8 | 9 | 9 |
|---|
|
| Constanza (1,200 meters) |
|---|
|
| Jan | Feb | Mar | Apr | May | Jun | Jul | Aug | Sep | Oct | Nov | Dec |
|---|
| Min temp. | 9 | 10 | 11 | 12 | 13 | 13 | 13 | 13 | 13 | 13 | 12 | 11 |
|---|
| Max temp. | 23 | 24 | 25 | 25 | 25 | 26 | 26 | 26 | 26 | 26 | 24 | 23 |
|---|
| Precip. | 75 | 80 | 80 | 150 | 320 | 165 | 155 | 180 | 245 | 275 | 160 | 105 |
|---|
| Prec. days | 14 | 12 | 12 | 12 | 15 | 15 | 17 | 17 | 17 | 18 | 15 | 15 |
|---|
|
|
|
|
| La Romana |
|---|
|
| Jan | Feb | Mar | Apr | May | Jun | Jul | Aug | Sep | Oct | Nov | Dec |
|---|
| Min temp. | 20 | 20 | 20 | 22 | 24 | 25 | 25 | 24 | 24 | 24 | 22 | 21 |
|---|
| Max temp. | 29 | 30 | 30 | 30 | 31 | 32 | 33 | 32 | 32 | 31 | 30 | 30 |
|---|
| Precip. | 35 | 30 | 30 | 45 | 90 | 55 | 60 | 105 | 115 | 165 | 95 | 50 |
|---|
| Prec. days | 5 | 4 | 4 | 5 | 7 | 6 | 6 | 8 | 9 | 10 | 8 | 6 |
|---|
|
|
|
|
| Puerto Plata |
|---|
|
| Jan | Feb | Mar | Apr | May | Jun | Jul | Aug | Sep | Oct | Nov | Dec |
|---|
| Min temp. | 21 | 21 | 21 | 22 | 24 | 24 | 25 | 25 | 24 | 24 | 23 | 22 |
|---|
| Max temp. | 28 | 28 | 29 | 29 | 31 | 32 | 32 | 32 | 32 | 32 | 30 | 29 |
|---|
| Precip. | 190 | 130 | 145 | 150 | 150 | 55 | 70 | 80 | 90 | 145 | 260 | 195 |
|---|
| Prec. days | 12 | 9 | 8 | 10 | 11 | 6 | 7 | 7 | 7 | 10 | 14 | 15 |
|---|
|
|
| Sun hours | 7 | 7 | 8 | 8 | 7 | 8 | 8 | 8 | 7 | 7 | 6 | 6 |
|---|
|
| Punta Cana |
|---|
|
| Jan | Feb | Mar | Apr | May | Jun | Jul | Aug | Sep | Oct | Nov | Dec |
|---|
| Min temp. | 21 | 21 | 22 | 22 | 24 | 24 | 24 | 24 | 24 | 24 | 23 | 22 |
|---|
| Max temp. | 28 | 29 | 29 | 30 | 30 | 31 | 32 | 32 | 32 | 32 | 30 | 29 |
|---|
| Precip. | 85 | 65 | 50 | 65 | 130 | 95 | 85 | 105 | 135 | 125 | 130 | 90 |
|---|
| Prec. days | 10 | 7 | 7 | 7 | 10 | 9 | 9 | 10 | 10 | 11 | 12 | 11 |
|---|
|
|
| Sun hours | 8 | 9 | 9 | 9 | 8 | 9 | 9 | 9 | 8 | 8 | 8 | 8 |
|---|
|
| Sabana De La Mar |
|---|
|
| Jan | Feb | Mar | Apr | May | Jun | Jul | Aug | Sep | Oct | Nov | Dec |
|---|
| Min temp. | 19 | 18 | 19 | 20 | 21 | 22 | 22 | 22 | 22 | 21 | 20 | 19 |
|---|
| Max temp. | 28 | 29 | 29 | 30 | 31 | 31 | 31 | 32 | 32 | 31 | 30 | 29 |
|---|
| Precip. | 150 | 110 | 100 | 155 | 250 | 175 | 200 | 230 | 225 | 245 | 285 | 175 |
|---|
| Prec. days | 13 | 10 | 10 | 9 | 15 | 14 | 16 | 16 | 16 | 16 | 16 | 15 |
|---|
|
|
|
|
| Santiago |
|---|
|
| Jan | Feb | Mar | Apr | May | Jun | Jul | Aug | Sep | Oct | Nov | Dec |
|---|
| Min temp. | 18 | 19 | 19 | 21 | 22 | 23 | 23 | 23 | 22 | 22 | 21 | 19 |
|---|
| Max temp. | 29 | 30 | 31 | 32 | 32 | 33 | 34 | 34 | 34 | 33 | 31 | 30 |
|---|
| Precip. | 55 | 40 | 60 | 110 | 135 | 65 | 50 | 70 | 85 | 110 | 95 | 70 |
|---|
| Prec. days | 8 | 6 | 6 | 8 | 10 | 5 | 7 | 7 | 8 | 9 | 10 | 10 |
|---|
|
|
| Sun hours | 7 | 7 | 8 | 8 | 8 | 8 | 8 | 8 | 8 | 8 | 7 | 7 |
|---|
|
| Santo Domingo |
|---|
|
| Jan | Feb | Mar | Apr | May | Jun | Jul | Aug | Sep | Oct | Nov | Dec |
|---|
| Min temp. | 20 | 19 | 20 | 21 | 22 | 23 | 23 | 23 | 23 | 23 | 22 | 21 |
|---|
| Max temp. | 30 | 30 | 31 | 31 | 31 | 32 | 33 | 33 | 33 | 32 | 31 | 31 |
|---|
| Precip. | 65 | 55 | 55 | 70 | 190 | 140 | 145 | 175 | 180 | 185 | 100 | 85 |
|---|
| Prec. days | 8 | 6 | 6 | 7 | 11 | 10 | 11 | 12 | 12 | 13 | 9 | 9 |
|---|
| Humidity | 82% | 80% | 79% | 80% | 81% | 81% | 81% | 82% | 83% | 84% | 84% | 83% |
|---|
| Day length | 11 | 12 | 12 | 13 | 13 | 13 | 13 | 13 | 12 | 12 | 11 | 11 |
|---|
| Sun hours | 8 | 8 | 8 | 8 | 8 | 8 | 7 | 7 | 7 | 7 | 8 | 7 |
|---|
| Sea temp | 27 | 26 | 26 | 27 | 28 | 28 | 28 | 29 | 29 | 29 | 28 | 27 |
|---|
See also the
temperatures month by month