Select units of measurement for the temperature and rainfall tables (metric or imperial).
Average weather, temperature, rainfall, sunshine
The climate in the Bahamas is
tropical, with a hot, rainy season from May to October (in which, however, the breezes temper the heat) and a cooler season from November to April, which is felt more on the north-western islands.
The archipelago of the Bahamas is stretched along a
northwest-southeast axis: the northernmost islands are located to the east of Florida, while the southernmost ones are located to the northwest of Haiti.
Proceeding from north-west to south-east, there is an increase in the winter temperatures as well as a decrease in the summer precipitation: this means that the north-western islands (Grand Bahama, Little Abaco, Andros and New Providence, where the capital, Nassau, is located) are cooler in winter and rainier in summer.
The amount of
sunshine in the Bahamas is good throughout the year, in fact, the summer rains fall mainly in the form of showers and thunderstorms, so the sky doesn't remain overcast for a long time.
The
sea is warm enough for swimming all year round, even though on the northern islands it is slightly cooler, at least in the winter months: in Nassau the water temperature ranges from 24.5 °C (76 °F) from January to March to 29.5 °C (85 °F) in August and September.
The climate in detail
Temperature and rain
Rainfall amounts to almost 1,500 millimeters (60 inches) per year in Freeport, in the north-west, while it drops to 1,400 mm (55 in) in Nassau, to 1,100 mm (43 in) in Eleuthera and San Salvador, to 800 mm (31.5 in) in Mayaguana, and to just 650 mm (25.5 in) in Inagua. On the south-eastern islands, not only the total amount of rainfall is quite scarce, but also there is a fairly significant decrease in the summer rains, especially in July.
As for the
temperatures, the main differences occur in winter, which is cooler in the northwest and warmer in the southeast, while summer is hot and muggy everywhere.
In the
coolest months (January and February), the average daily temperature is around 20 °C (68 °F) on the northernmost islands (Grand Bahama, Abaco), around 22 °C (72 °F) in New Providence and Eleuthera, 22.5 °C (72.5 °F) in San Salvador, 23 °C (73.5 °F) in Mayaguana, and 24.5 °C (76 °F) in Inagua.
In winter, from December to March,
cold air masses from the United States can lower the temperature for a few days, especially on the north-western islands, so much so that at night it can get cold, even below 10 °C (50 °F) in Freeport and Nassau; in addition, weather fronts can bring a bit of rain, clouds and wind.
On the other hand, the temperatures in the
warmest months (July and August) are similar throughout the islands, in fact the daily average is everywhere around 28/29 °C (82/84 °F).
North-western islands
Freeport
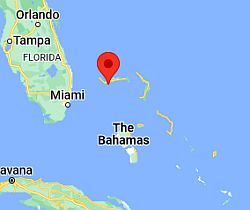 Freeport, where is located

In Freeport, located on the island of
Grand Bahama, the most northwestern of the archipelago, the temperatures resemble those of West Palm Beach (Florida), which is not far.
Normally, in winter the temperatures are pleasantly warm, but the island is particularly exposed to
cold air outbreaks because of its location. The temperature dropped to 3 °C (37 °F) in January 1977 (and it seems that there was also a brief snowfall), to 6 °C (43 °F) in January 1981, and to 5 °C (41 °F) in February 1996, in January 2010 and in January 2022.
In Freeport, 1,500 mm (60 in) of rain fall per year, with a maximum in August and September. However, even in the driest period, from December to April, some rain showers can occur.
Nassau
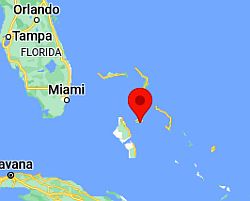 Nassau, where is located

As mentioned, Nassau is located on the island of
New Providence, a little further to the south than Freeport, and at the same latitude as Miami. The average temperature ranges from around 22 °C (71.5 °F) in January to around 29 °C (84 °F) in July and August.
Here too, from December to March there may be short cool periods, sometimes a bit cold. The temperature dropped to 7 °C (44.5 °F) in January 1977, to 6 °C (43 °F) in January 1981, to 7 °C (44.5 °F) in February 1996, and to 9 °C (48 °F) in January 2010.
In Nassau, the rains are still quite abundant, 1,425 mm (56 in) on average.
South-eastern islands
Abrahams Bay
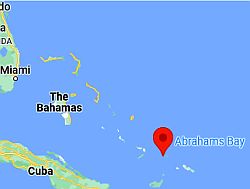 Abraham's Bay, where is located

In Abraham's Bay, on the southern island of
Mayaguana: as you can see, in winter the temperatures are a little higher than on the northwestern islands, especially at night.
In Abraham's Bay, 800 mm (32 in) of rain fall per year, and rainfall exceeds 100 mm (4 in) per month only between September and November. In July and August, there are only short showers, quite frequent but not intense.
Matthew Town
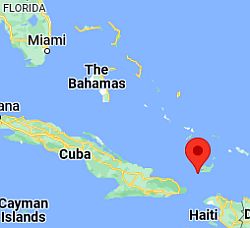 Matthew Town, where is located

On the arid island of
Great Inagua (see Matthew Town), the southernmost one, the rains are even scarcer.
In Inagua, the temperatures are generally high even in winter.
On the southern islands, the sea temperature is a little higher in winter than in the northern ones, in fact it does not drop below 25/26 °C (77/79 °F).

Hurricanes
From June to November, the Bahamas can be affected by
hurricanes, the tropical cyclones of the Atlantic and the Caribbean, which, however, are more likely to occur from August to October.
Some intense hurricanes that hit the archipelago were the «Nassau hurricane» in late July 1926, the «Bahamas hurricane» (or Great Abaco hurricane) in September 1932, hurricane Betsy in September 1965, Andrew in August 1992, Floyd in September 1999, Frances in September 2004, Wilma in October 2005, Irene in August 2011, Joaquin in October 2015, Matthew in October 2016, and Irma in September 2017.
In early September 2019, Hurricane Dorian was the most intense in history to hit the Bahamas.
When to go
In general, the best time to visit the Bahamas is the dry season,
from late November to mid-April. However, on the north-western islands, from December to March the temperature is often not high enough for a beach holiday, and sometimes there are also some cool and windy days. On the southernmost islands, however, and in particular in Inagua, the winter is warm enough to enjoy the sun and the sea, while on the northernmost islands you may prefer April and May (though in the latter month the rains are a bit more frequent).
From May to October, the weather is hot and muggy, and thunderstorms can be intense (at least on the northern islands), although the sun is still frequent. If you want to choose the summer, the month of July is preferable both because there's a relative decrease in the rains (though this not happens in Nassau and on the north-westernmost islands) and because hurricanes are less likely than in August.
What to pack
From
November to April, on the northernmost islands, bring light clothing, but also a sweatshirt or sweater, a scarf for the breeze, a jacket and an umbrella. On the southern islands, bring light clothes, a sweatshirt for the evening, a scarf for the breeze.
From
May to October, bring light, tropical clothing, and possibly a light sweatshirt and a light raincoat for thunderstorms.
When going to the reef, you can bring snorkeling equipment, including water shoes or rubber-soled shoes.
Climate data - Bahamas
| Abrahams Bay |
|---|
|
| Jan | Feb | Mar | Apr | May | Jun | Jul | Aug | Sep | Oct | Nov | Dec |
|---|
| Min temp. | 20 | 21 | 21 | 22 | 23 | 24 | 25 | 25 | 24 | 24 | 22 | 21 |
|---|
| Max temp. | 26 | 27 | 27 | 28 | 30 | 31 | 31 | 32 | 31 | 31 | 28 | 27 |
|---|
| Precip. | 45 | 40 | 30 | 45 | 70 | 80 | 45 | 65 | 105 | 130 | 105 | 60 |
|---|
| Prec. days | 7 | 6 | 7 | 7 | 11 | 11 | 11 | 12 | 13 | 14 | 9 | 7 |
|---|
|
|
|
|
| Freeport |
|---|
|
| Jan | Feb | Mar | Apr | May | Jun | Jul | Aug | Sep | Oct | Nov | Dec |
|---|
| Min temp. | 17 | 17 | 18 | 20 | 22 | 24 | 25 | 25 | 24 | 22 | 20 | 18 |
|---|
| Max temp. | 25 | 25 | 26 | 28 | 30 | 31 | 32 | 33 | 32 | 30 | 27 | 26 |
|---|
| Precip. | 85 | 75 | 95 | 65 | 105 | 175 | 165 | 210 | 215 | 145 | 95 | 75 |
|---|
| Prec. days | 9 | 8 | 8 | 7 | 11 | 14 | 16 | 19 | 18 | 11 | 10 | 9 |
|---|
|
|
| Sun hours | 7 | 8 | 9 | 9 | 9 | 9 | 9 | 9 | 8 | 8 | 7 | 7 |
|---|
| Sea temp | 24 | 24 | 24 | 25 | 26 | 28 | 29 | 30 | 29 | 28 | 26 | 25 |
|---|
| Matthew Town |
|---|
|
| Jan | Feb | Mar | Apr | May | Jun | Jul | Aug | Sep | Oct | Nov | Dec |
|---|
| Min temp. | 21 | 21 | 21 | 22 | 23 | 25 | 25 | 25 | 25 | 24 | 23 | 22 |
|---|
| Max temp. | 28 | 29 | 29 | 30 | 30 | 31 | 32 | 32 | 31 | 30 | 29 | 28 |
|---|
| Precip. | 50 | 35 | 35 | 40 | 85 | 30 | 20 | 50 | 85 | 120 | 70 | 35 |
|---|
| Prec. days | 6 | 5 | 4 | 5 | 6 | 4 | 4 | 5 | 7 | 10 | 8 | 6 |
|---|
|
|
|
|
| Nassau |
|---|
|
| Jan | Feb | Mar | Apr | May | Jun | Jul | Aug | Sep | Oct | Nov | Dec |
|---|
| Min temp. | 18 | 18 | 19 | 21 | 22 | 24 | 25 | 25 | 25 | 24 | 21 | 20 |
|---|
| Max temp. | 26 | 27 | 27 | 29 | 30 | 32 | 33 | 33 | 32 | 31 | 28 | 27 |
|---|
| Precip. | 45 | 50 | 55 | 75 | 140 | 220 | 160 | 210 | 195 | 150 | 85 | 45 |
|---|
| Prec. days | 7 | 5 | 6 | 7 | 10 | 15 | 16 | 18 | 17 | 13 | 9 | 7 |
|---|
|
|
| Sun hours | 7 | 8 | 9 | 9 | 9 | 8 | 9 | 8 | 8 | 8 | 8 | 7 |
|---|
| Sea temp | 25 | 24 | 24 | 25 | 26 | 28 | 29 | 30 | 29 | 28 | 27 | 25 |
|---|
See also the
temperatures month by month