Select units of measurement for the temperature and rainfall tables (metric or imperial).
Average weather, temperature, rainfall, sunshine
The climate of the U.S. Virgin Islands is
tropical, hot all year round, with a relatively cooler period from December to March, with average highs around 29 °C (84 °F), and a hotter and sultry period from May to October, with highs around 31/32 °C (88/90 °F), during which, however, the heat is tempered by the breeze.
As regards to the
rainfall, there is a relatively dry season from January to April and a
rainy season from May to December, during which there's a relative decrease in precipitation in June and July. The least rainy months are February and March. Rainfall hovers around 1,000/1,200 millimeters (40/47 inches) per year and is generally slightly more abundant on the northern slopes of each island.
By April the rains increase, which however remain moderate until July, and then increase more decisively starting from August. Generally, the wettest period runs
from September to November.
The U.S. Virgin Islands are an archipelago located east of Puerto Rico, in the group of the Lesser Antilles. There are three main islands,
Saint John and
Saint Thomas, more to the north, and
Saint Croix, to the south.
The climate in detail
Temperature and rain

In
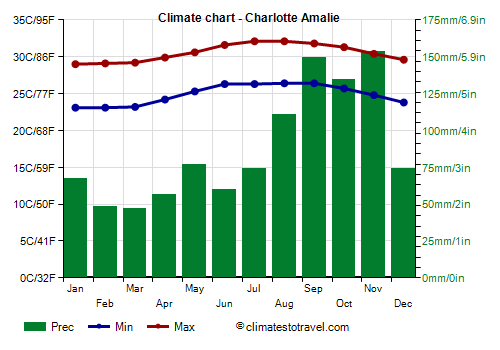
Charlotte Amalie, the capital, located on the island of Saint Thomas, the average temperature fluctuates between around 26 °C (79 °F) from January to March, to around 29 °C (84 °F) from June to September.
Considering that we are in the tropics, the rains in Charlotte Amalie are not very abundant, since they amount to 1,050 mm (41 in) per year. The only period in which rainfall exceeds 100 mm (4 in) per month is from August to November.
Apart from hurricanes, which can bring strong winds and torrential rains (see below), the weather is normally nice or variable, only interrupted by short showers and thunderstorms, which are more likely and more intense during the rainy season: so, the
sun shines for many hours throughout the year, in fact there are almost 3,000 hours of sunshine per year.

In
Christiansted, located on the island of Saint Croix, which as mentioned is further south, the rainfall is even less abundant, amounting to 940 mm (37 in) per year. The pattern is similar, however the rainfall exceeds 100 mm (4 in) per month only from September to November.
Sea temperature
The
sea in the U.S. Virgin Islands is warm enough to swim in all year round: the water temperature is around 26 °C (79 °F) in February and March, and around 29 °C (84 °F) in September and October.
Hurricanes
From June to November, here as in the whole area of the West Indies, there is the danger of
tropical storms and hurricanes, with greater probability from August to October. In September 2017, the island of Saint Croix was hit in full force by Hurricane Maria.
When to go
The best time to visit the U.S. Virgin Islands is
from December to April, since it is the least hot period of the year and outside of the hurricane period; in particular,
January, February and March are the driest months. December can still be a rainy month, especially on the southern island of Saint Croix.
In April, there is a certain increase in temperature, and during some years, also in the intensity of thunderstorms, but overall, it's still an acceptable month, and in many cases, it is good.
In summer, June and July are generally not as rainy as August and September, and have also a lower risk of tropical storms and hurricanes, which, as mentioned, are most likely between August and October, that is, when the sea is warmer and has more energy to provide.
What to pack
From
December to April: pack light clothes, and possibly a scarf for the breeze and a sweatshirt for the evening.
From
May to November: pack lightweight clothing, and possibly a light sweatshirt and a light raincoat for thunderstorms; a sweatshirt and a pashmina for airconditioned places.
Climate data - United States Virgin Islands
| Charlotte Amalie |
|---|
|
| Jan | Feb | Mar | Apr | May | Jun | Jul | Aug | Sep | Oct | Nov | Dec |
|---|
| Min temp. | 23 | 23 | 23 | 24 | 25 | 26 | 26 | 26 | 26 | 26 | 25 | 24 |
|---|
| Max temp. | 29 | 29 | 29 | 30 | 31 | 32 | 32 | 32 | 32 | 31 | 30 | 30 |
|---|
| Precip. | 65 | 50 | 45 | 55 | 75 | 60 | 75 | 110 | 150 | 135 | 155 | 75 |
|---|
| Prec. days | 10 | 9 | 7 | 7 | 8 | 7 | 10 | 11 | 12 | 13 | 14 | 12 |
|---|
| Humidity | 73% | 72% | 71% | 72% | 74% | 72% | 72% | 73% | 75% | 76% | 76% | 74% |
|---|
|
| Sun hours | 8 | 8 | 9 | 9 | 8 | 8 | 9 | 9 | 8 | 8 | 7 | 7 |
|---|
| Sea temp | 26 | 26 | 26 | 27 | 27 | 28 | 28 | 29 | 29 | 29 | 28 | 27 |
|---|
| Christiansted |
|---|
|
| Jan | Feb | Mar | Apr | May | Jun | Jul | Aug | Sep | Oct | Nov | Dec |
|---|
| Min temp. | 22 | 22 | 22 | 23 | 24 | 25 | 25 | 25 | 25 | 24 | 24 | 22 |
|---|
| Max temp. | 29 | 29 | 29 | 30 | 31 | 32 | 32 | 32 | 32 | 31 | 30 | 30 |
|---|
| Precip. | 50 | 35 | 40 | 55 | 90 | 50 | 65 | 80 | 125 | 130 | 135 | 85 |
|---|
| Prec. days | 10 | 8 | 7 | 6 | 8 | 8 | 11 | 11 | 12 | 12 | 12 | 12 |
|---|
| Humidity | 74% | 71% | 70% | 71% | 74% | 73% | 73% | 74% | 75% | 76% | 76% | 75% |
|---|
|
|
| Sea temp | 27 | 26 | 26 | 27 | 27 | 28 | 28 | 29 | 29 | 29 | 28 | 27 |
|---|