Select units of measurement for the temperature and rainfall tables (metric or imperial).
Average weather, temperature, rainfall, sunshine
The climate in Sint Maarten is
tropical, with a relatively cool period from December to March and a hot, muggy period from May to October.
The
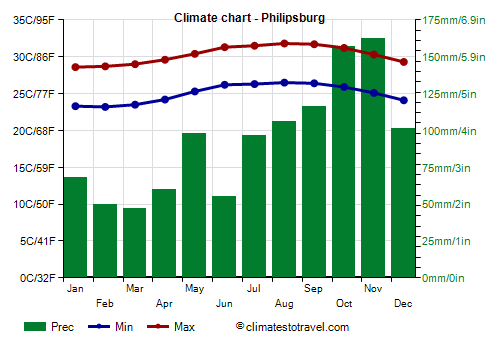
rains are generally not very abundant, however, they are generally more abundant from August to November, and scarcer from January to April. In any case, the rains, which generally occur in the form of showers or thunderstorms, are quite irregular from one year another.
Sint Maarten is an island of the Lesser Antilles, located at a latitude of 18 degrees north, and it is administratively divided between France and the Netherlands; here, we are dealing with the
Dutch side, which is located in the south (on the French side, we find instead
Saint Martin).
The climate in detail
Temperature and rain

In Philipsburg, the capital, the daily average
temperature ranges from 26 °C (79 °F) between January and March to 29 °C (84 °F) between June and October. In the warmest season, there's hot and muggy weather, though the breeze gives some relief.
In Philipsburg, 1,150 mm (45 in) fall each year. February and March are the driest months, while the wettest months are October and November.
However, the rains usually occur in the form of downpours or thunderstorms, which do not last long, so the
sun shines throughout the year.

Sea temperature
In Sint Maarten, the
sea is warm enough for swimming all year round, in fact the water temperature ranges from around 26 °C (79 °F) in January and February, to 29 °C (84 °F) in September and October.
Hurricanes
In the period from June to November (but mostly from August to October), Sint Maarten can be hit by tropical depressions and
hurricanes, as happens in general in the Caribbean.
When to go
The best time to visit the island where Sint Maarten is located goes
from December to April, since it is the least hot period of the year and outside the hurricane season; in particular, the period from February to March is usually the least rainy.
In May, both temperature and moisture increase, but the rains are not yet too abundant, and the hurricane season has not yet begun.
In summer, June and July are not as rainy as August and September, in addition, tropical storms and hurricanes are less likely to occur than in the following months.
What to pack
All year round: bring
light clothes of natural fabric, and possibly a light sweatshirt and a light raincoat for thunderstorms, especially from August to November. From December to March, you can add a light sweatshirt for the evening.
When going to the reef, you can bring snorkeling equipment, including water shoes or rubber-soled shoes.
Climate data - Sint Maarten
| Philipsburg |
|---|
|
| Jan | Feb | Mar | Apr | May | Jun | Jul | Aug | Sep | Oct | Nov | Dec |
|---|
| Min temp. | 23 | 23 | 24 | 24 | 25 | 26 | 26 | 26 | 26 | 26 | 25 | 24 |
|---|
| Max temp. | 29 | 29 | 29 | 30 | 30 | 31 | 32 | 32 | 32 | 31 | 30 | 29 |
|---|
| Precip. | 70 | 50 | 45 | 60 | 100 | 55 | 95 | 105 | 115 | 155 | 160 | 100 |
|---|
| Prec. days | 13 | 11 | 8 | 8 | 10 | 9 | 13 | 14 | 13 | 14 | 14 | 14 |
|---|
| Humidity | 73% | 72% | 70% | 71% | 74% | 73% | 72% | 73% | 74% | 74% | 74% | 73% |
|---|
| Day length | 11 | 12 | 12 | 13 | 13 | 13 | 13 | 13 | 12 | 12 | 11 | 11 |
|---|
| Sun hours | 8 | 8 | 9 | 9 | 8 | 8 | 8 | 9 | 8 | 8 | 8 | 8 |
|---|
| Sea temp | 26 | 26 | 26 | 27 | 27 | 28 | 28 | 29 | 29 | 29 | 28 | 27 |
|---|