Select units of measurement for the temperature and rainfall tables (metric or imperial).
Average weather, temperature, rainfall, sunshine
In Puerto Rico there is a
tropical climate, hot all year round, with a hot and muggy season from May to October and a relatively cool season from December to March, with November and April as intermediate months.
The north-east
trade winds, which blow all year round, but especially in the cool season, starting from November, deposit the moisture that has been picked up in the sea in the form of rain, especially on the northern side, which therefore is rainier than the southern one.
As a result, as regards to the
rains, the hot and muggy period from May to October tends to be rainy everywhere, although on the southern coast there is a relative decrease in June and July. On the other hand, in the first months when the north-east trade winds blow (November and December, and partly January), the rains are still abundant on the north coast, where therefore there is a relatively dry period that is shorter, from January to April.
Every now and then, from December to March, the archipelago can be affected by some
frontal systems from the United States, which can bring some clouds and rains, and also a
cool wind, able to lower the temperature by a few degrees, although in a less noticeable way than in Cuba and Yucatan (Mexico), which are closer to the American continent.
Anyway, the temperature in these cases can drop below 10 °C (50 °F) in the inland hilly areas, and around freezing in the mountains.
The
sea in Puerto Rico is warm enough for swimming all year round: the water temperature ranges from 26 °C (79 °F) in February and March to 29 °C (84 °F) in September and October.
Puerto Rico is a Caribbean island and an unincorporated territory of the United States, located east of the Dominican Republic.
The climate in detail
North coast
The north coast receives more rain, and is also slightly cooler than the south, because the north-east trade winds reach it directly from the sea.
San Juan

In the capital,
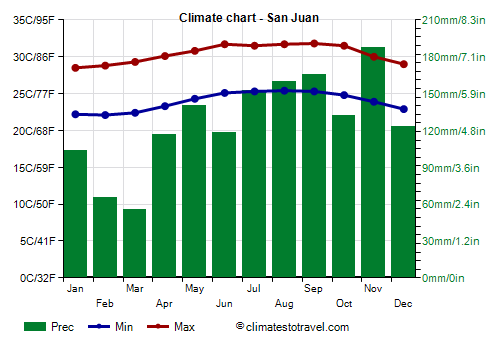
San Juan, located on the northern coast, the average temperature is just over 25 °C (77 °F) in January, while it is around 28.5 °C (83.5 °F) from June to September.
In
San Juan, 1,500 millimeters (60 inches) of rain fall per year, including more than 100 mm (4 in) per month between May and December, while the driest months, with 55/65 mm (2.1/2.6 in) of rain per month, are
February and March, that is, at the end of the period of the trade winds, when they become weaker.
Anyway, the rains in Puerto Rico occur mainly in the form of showers or thunderstorms, which usually do not last long, so the amount of
sunshine is always good.
South coast
On the south coast, the daytime temperature in winter is slightly higher because the prevailing winds, the northeast trade winds, come from the interior.
Ponce

In
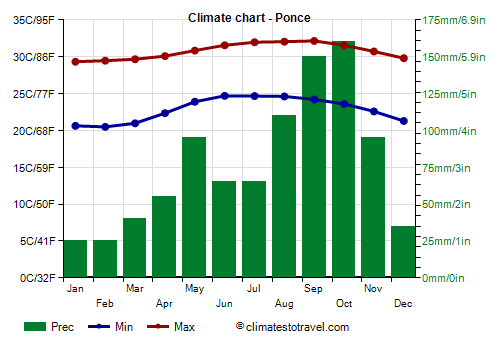
Ponce, located in the central part of the south coast, the maximum temperatures exceed 29 °C (84 °F) even in January and February.
Along the southern coast, which is sheltered from the trade winds, rainfall often drops below 1,000 mm (40 in) per year, and
winter is particularly dry, as happens in La Parguera and Ponce. In addition, even June and July are not very rainy.

The small island called
Isla Mona, to the west, is almost arid, while
Vieques, to the east, is a bit rainier, since it receives 1,070 mm (42 in) of rain per year.
Hills and mountains
The interior of Puerto Rico is crossed by a mountain range called
Cordillera Central.
Here, the temperature decreases with increasing altitude: for example, in
Adjuntas, at 500 meters (1,600 feet) above sea level, highs range from 25 °C (77 °F) in winter to 29 °C (77 to 84 °F) in summer.
Cerro Maravilla

On the other hand, on
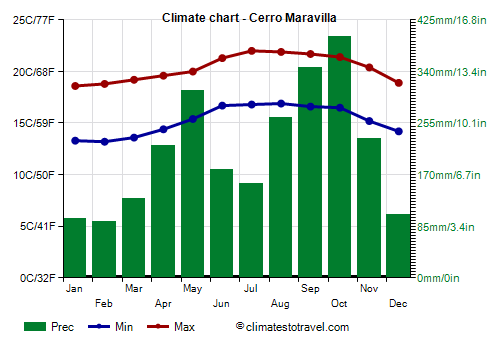
Cerro Maravilla, the fourth highest peak on the island, at 1,200 meters (3,900 feet), highs range from 20 °C (68 °F) in winter to 23 °C (73 °F) in summer.
Here, 2,500 mm (98 in) of rain fall per year.
The
rainiest areas are the northern slopes of the
Cordillera Central, where there is no real dry season, and in particular, those of the Caribbean National Forest (or
El Yunque): on
Pico del Este, about 1,000 meters (3,300 feet) above sea level, 4,300 mm (170 in) of rain fall per year.
Hurricanes
From June to November, the archipelago can be hit by tropical storms and
hurricanes, with a higher probability between August and October. The archipelago was hit hard by Hurricane Georges in September 1998 and by Hurricane Maria in September 2017.
However, even when they are not intense, tropical storms can produce heavy rains in mountainous areas, which can cause landslides and floods.
When to go
In general, the coolest and least rainy period in Puerto Rico runs from
December to March, which is also outside of the hurricane season.
More in detail, a better period can be distinguished
depending on the zones: since it is generally the least rainy periods, the best time is February-March along the north and east coasts, and from December to March along the south and west coasts.
In
April, there is already a certain increase in rainfall, especially in inland areas, while the rains on the southern coast are still quite rare.
In
summer, the heat is sweltering and rainfall is frequent, although it generally occurs in the form of downpours and thunderstorms that do not last long, so after a while, they give way to the sun. However, there is some risk of tropical storms and hurricanes.
If you want to visit Puerto Rico in summer, you may prefer the
south coast, which is less rainy, especially in June and July, when there is a certain decrease in precipitation, in addition, the risk of hurricanes in these months is lower than in August.
The Americans have introduced the habit of using air conditioning, so the temperature inside buildings is often much lower than outdoors: it can be useful to bring some warmer clothes, at least for those who are sensitive to cold.
What to pack
From
December to April: bring light clothes, and a sweatshirt for the evening.
From
May to November: bring tropics-friendly, lightweight clothing, and possibly a light sweatshirt and a light raincoat for thunderstorms. Add a light sweatshirt and a pashmina for airconditioned places.
Climate data - Puerto Rico
| Cerro Maravilla (1,200 meters) |
|---|
|
| Jan | Feb | Mar | Apr | May | Jun | Jul | Aug | Sep | Oct | Nov | Dec |
|---|
| Min temp. | 13 | 13 | 14 | 14 | 15 | 17 | 17 | 17 | 17 | 16 | 15 | 14 |
|---|
| Max temp. | 19 | 19 | 19 | 20 | 20 | 21 | 22 | 22 | 22 | 21 | 20 | 19 |
|---|
| Precip. | 95 | 90 | 130 | 220 | 310 | 180 | 155 | 265 | 345 | 400 | 230 | 105 |
|---|
| Prec. days | 12 | 11 | 12 | 14 | 16 | 12 | 11 | 15 | 18 | 20 | 15 | 12 |
|---|
|
|
|
|
| Ponce |
|---|
|
| Jan | Feb | Mar | Apr | May | Jun | Jul | Aug | Sep | Oct | Nov | Dec |
|---|
| Min temp. | 21 | 20 | 21 | 22 | 24 | 25 | 25 | 25 | 24 | 24 | 23 | 21 |
|---|
| Max temp. | 29 | 29 | 30 | 30 | 31 | 32 | 32 | 32 | 32 | 32 | 31 | 30 |
|---|
| Precip. | 25 | 25 | 40 | 55 | 95 | 65 | 65 | 110 | 150 | 160 | 95 | 35 |
|---|
| Prec. days | 6 | 6 | 6 | 7 | 10 | 8 | 8 | 10 | 11 | 13 | 10 | 7 |
|---|
|
|
|
| Sea temp | 27 | 26 | 26 | 27 | 28 | 28 | 28 | 29 | 29 | 29 | 28 | 27 |
|---|
| San Juan |
|---|
|
| Jan | Feb | Mar | Apr | May | Jun | Jul | Aug | Sep | Oct | Nov | Dec |
|---|
| Min temp. | 22 | 22 | 22 | 23 | 24 | 25 | 25 | 25 | 25 | 25 | 24 | 23 |
|---|
| Max temp. | 28 | 29 | 29 | 30 | 31 | 32 | 32 | 32 | 32 | 32 | 30 | 29 |
|---|
| Precip. | 105 | 65 | 55 | 115 | 140 | 120 | 155 | 160 | 165 | 130 | 185 | 125 |
|---|
| Prec. days | 13 | 10 | 9 | 10 | 12 | 11 | 14 | 15 | 15 | 14 | 16 | 15 |
|---|
|
|
| Sun hours | 8 | 8 | 9 | 9 | 8 | 9 | 9 | 9 | 8 | 7 | 7 | 7 |
|---|
| Sea temp | 27 | 26 | 26 | 27 | 28 | 28 | 28 | 29 | 29 | 29 | 28 | 27 |
|---|
See also the
temperatures month by month