Select units of measurement for the temperature and rainfall tables (metric or imperial).
Average weather, temperature, rainfall, sunshine
Anguilla has a
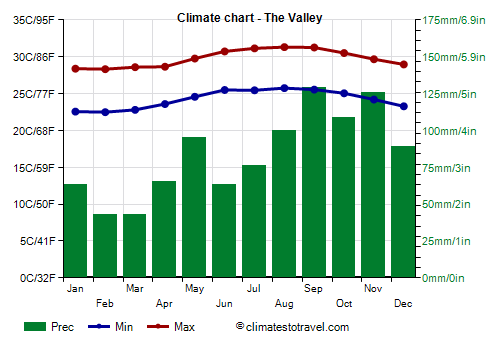
tropical climate, hot all year round, with a slightly cooler period from December to March and a hotter, muggy period from May to October. Luckily, sea breezes are able to relieve a bit the heat of the day.
Rainfall is generally not very abundant, since it amounts to around 1,000 millimeters (40 inches) per year.
As normally happens in tropical areas, the rains usually fall in the form of downpours or thunderstorms, in days when the sun shines for a few hours anyway. More rarely, there can be heavy and prolonged rains, when tropical depressions and hurricanes hit the islands (see below).
Anguilla is located in the northernmost part of the Lesser Antilles, and it's a British overseas territory, formed by the main island, where the capital,
The Valley, is found, plus some small coral islands.
The Valley

February and March are usually the driest months, with about 45 mm (1.8 in) per month on average, while in the rest of the year, the rains are quite irregular, although they rarely reach high values. Normally, the rainy period is from August to November, though with moderate rainfall, between 100 and 130 mm (4 and 5 in) per month. During some years, there may be another peak of precipitation in April and May.
The amount of
sunshine is good all year round. On average, there are around 3,000 hours of sunshine per year.
 Anguilla
Sea temperature
The
sea in Anguilla is warm enough for swimming all year round, in fact the water temperature is around 26 °C (79 °F) in the January-April period, while it reaches 29 °C (84 °F) in September and October.
Hurricanes
From June to November, in Anguilla as in the whole area of the West Indies, there is the danger of
tropical storms and hurricanes, with greater probability from August to October.
When to go
The best time to visit Anguilla runs from
December to April, a period when the temperatures are a bit lower and outside of the hurricane season, and particularly the months of
February and March, which are the driest ones.
In summer, in June and July, it usually rains a bit less than in August, and there is also a lower probability of hurricanes.
What to pack
From
December to April: bring light clothing, and a light sweater or sweatshirt for the evening and for the breeze.
From
May to November: bring lightweight, loose-fitting clothing, and possibly a light sweatshirt and a light raincoat for thunderstorms.
When going to the reef, you can bring snorkeling equipment, including water shoes or rubber-soled shoes.
Climate data - Anguilla
| The Valley |
|---|
|
| Jan | Feb | Mar | Apr | May | Jun | Jul | Aug | Sep | Oct | Nov | Dec |
|---|
| Min temp. | 23 | 22 | 23 | 24 | 25 | 26 | 25 | 26 | 26 | 25 | 24 | 23 |
|---|
| Max temp. | 28 | 28 | 29 | 29 | 30 | 31 | 31 | 31 | 31 | 31 | 30 | 29 |
|---|
| Precip. | 65 | 45 | 45 | 65 | 95 | 65 | 75 | 100 | 130 | 110 | 125 | 90 |
|---|
| Prec. days | 10 | 8 | 7 | 8 | 10 | 8 | 9 | 12 | 13 | 12 | 13 | 12 |
|---|
|
| Day length | 11 | 12 | 12 | 13 | 13 | 13 | 13 | 13 | 12 | 12 | 11 | 11 |
|---|
| Sun hours | 8 | 8 | 9 | 9 | 8 | 8 | 8 | 9 | 8 | 8 | 8 | 8 |
|---|
| Sea temp | 26 | 26 | 26 | 27 | 27 | 28 | 28 | 29 | 29 | 29 | 28 | 27 |
|---|