Select units of measurement for the temperature and rainfall tables (metric or imperial).
Average weather, temperature, rainfall, sunshine
In French Polynesia, the climate is
tropical, influenced by the south-east trade winds, with a hot and humid season from November to April and a cooler season from May to October. The hot season is also the rainiest, in addition, from December to April, there's the risk of
cyclones (except on the Marquesas Islands). The temperatures vary little throughout the year, but they are high on the northern islands and gradually cooler as you move to the south.
French Polynesia is a vast archipelago, located in the Pacific Ocean south of the equator.
The climate in detail
Marquesas Islands
The Marquesas are the northeasternmost islands of French Polynesia, are stretched from 8 to 10 degrees south latitude, and have a
warm climate all year round, besides, they are almost always out of the path of tropical cyclones. This means that, in theory, you can visit these islands all year round, although they are definitely muggy from December to April.
On these islands,
temperatures are fairly stable during the year, however, they decrease slightly in the austral winter, from June to August.
The
rains are not very abundant, being below 1,500 mm (60 in) per year. They are frequent from January to August, although they often occur in the form of short downpour or thunderstorm, while they become less frequent from September to December.
The Marquesas Islands are affected by the so-called ENSO cycle: during
El Niño years, rainfall increases, while during
La Niña years, periods of drought occur. Being equipped with elevations in inland areas, the Marquesas have different microclimates depending on slope exposure, and some coasts are almost dry.
However, considering also the rainfall records, the best time here runs from August to November.
Atuona
In
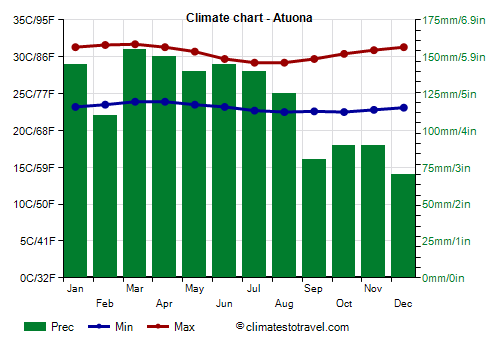
Atuona, located on the south coast of the island of Hiva Oa, at 9 degrees south latitude, the average temperature ranges from 28 °C (82.5 °F) in March to 26 °C (79 °F) in July and August.
The rains amount to 1,435 mm (56.5 in) per year, although they are quite erratic from year to year. In 1983, year of El Niño, 3,800 mm (150 in) of rain fell, while in 2010, year of La Niña, just 535 mm (21 in) fell.
On the Marquesas Islands, the sun frequently shines all year round; however, the sunshine hours decrease a little in the wettest months.
Owing to the location near the Equator, the
sea in the Marquesas is always warm, and the water temperature never drops below 27 °C (80.5 °F).
In Atuona, the painter Paul Gauguin is buried, after having spent the last years of his life here, even though he had previously lived for years in Tahiti.

Society Islands
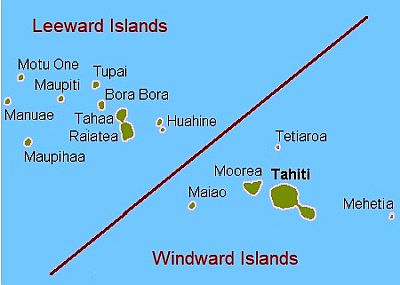
In the westernmost area of French Polynesia, from 16 to 18 degrees south latitude, we find the Society Islands group, divided between the
Windward Islands in the east (Tahiti, Moorea, Tetiaroa, Mehetia, and Maiao) and the
Leeward Islands in the west (Bora Bora, Huahine, Maupiti, Raiatea, Tahaa, Manuae, Maupihaa, Motu One, and Tupai).
On these islands too,
temperatures are fairly stable during the year, however, they decrease slightly in the austral winter, from June to August.
Instead, the
rains have a more regular pattern than in the Marquesas Islands, and are more frequent and abundant in the warm period, while they decrease in the southern hemisphere winter. On the largest islands, which host highlands in the interior, such as Tahiti, the slopes facing east (and therefore exposed to the trade winds) are rainier than the western ones, however, the islands are completely covered by forest, which means that there is no real dry season everywhere.
The amount of
sunshine is fairly uniform throughout the year as well, which means that even in the rainiest months, there's no shortage of sunshine: showers and downpour are simply more intense and more frequent, but they don't last long.
Bora-Bora
In
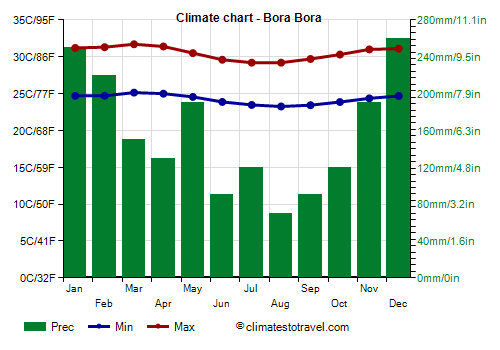
Bora-Bora atoll, at 16 degrees south latitude, the daytime temperature reaches or exceeds 31 °C (88 °F) from November to April, while it drops to 29 °C (84 °F) in July and August.
Given the enormous distance from the continents, temperatures vary little compared to the average, however, from November to April, they can sometimes reach 34/35 °C (93/95 °F).
At night, it never gets cold. In the southern hemisphere winter, from June to September, the temperature typically drops to 21 °C (70 °F) on cooler nights, but sometimes it can drop to slightly lower values: it dropped to 17.8 °C (64 °F) in July 1983 and to 17.7 °C (63.9 °F) in August and September 1997.
In Bora-Bora, about 1,900 millimeters mm (76 inches) of rain fall per year, with a maximum from November to March and a minimum from June to October.
The sun shines for a few hours a day even in the wettest period; however, the sunniest period is the least rainy, from June to September.
On the Society Islands, the
sea temperature is high throughout the year.
Tahiti
On the island of Tahiti, located 250 km (155 mi) southeast of Bora-Bora, the temperatures are similar to those of the latter, just slightly lower because of the position a little more to the south.
However, in the interior, there are
mountains, about 1,500 meters (5,000 feet) high (culminating in Mount Orohena), so on the west coast (see Papeete, Punaauia, Paea), more sheltered from the trade winds, the temperatures in winter are a little higher than on the eastern one, while the rains are less frequent.
In addition, in the hottest and sultriest months, a breeze called
Hupe blows from the mountains during the night, which is capable of reducing a little the feeling of sultriness.
In
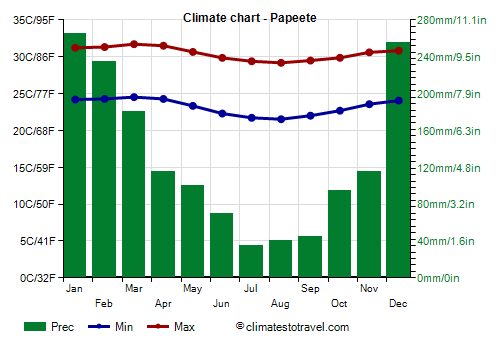
Papeete, the capital, located on the north-west coast of the island, in the coolest nights of the year, from June to September, the temperature generally drops to 19/20 °C (66/68 °F). In June 1982 it dropped to 16 °C (61 °F), while more recently, it dropped to 17 °C (62.5 °F) in June 1998 and August 1997.
From January to April, on the hottest days the temperature generally reaches 33 °C (91.5 °F), and more rarely 34/34.5 °C (93/94 °F).
In Tahiti, the rains are much more abundant on the eastern side than on the western one, and even more so in the mountains of the interior, and amount to 3,500 mm (137 in) Hitia'a, where it often rains even in the austral winter, while they drop to about 1,500 mm (59 in) in Papeete and Puna'auia, where they drop below 100 mm (4 in) per month from June to September.
In Papeete too, the amount of sunshine is decent during the hot and rainy season; however, the sunniest period is the least rainy, from June to September.
The Society Islands can be hit by
tropical cyclones from November to April (though less frequently than the westernmost islands of Oceania), , and this happens especially in El Niño periods. For example, Cyclone Veena hit Tahiti in April 1983, Oli hit Tahiti and Bora Bora in February 2010, and Osea hit Bora Bora in late November 1997.
The best time to visit the Society Islands is from May to mid-October, or better yet, from June to September, since it is the coolest and the least rainy of the year.
Tuamotu Islands
More to the east, we find the Tuamotu Islands, which cover a
large area, along a north-west to south-east axis 1,400 km (870 mi) long, and from 14 to 22 degrees south latitude. The main islands are Rangiroa, Anaa, Fakarava, Hao, and Makemo.
The climate is similar to that of the Society Islands, although there are some differences.
Temperatures are similar in the central-northern part, but are cooler in the southern part.
Rainfall amounts to 1,500 mm (60 in) per year in the north-western islands and to 1,200 mm (47 in) in the north-eastern ones, while it reaches 1,700 mm (67 in) in the southern ones, which are therefore more rainy. On these islands too, there is a relatively cool and dry period from June to September.
These islands are atolls, without mountains that could enhance rain-cloud development.
Furthermore, these islands are less exposed to tropical cyclones, since they are located in the eastern edge of the area where they can form.
Takaroa
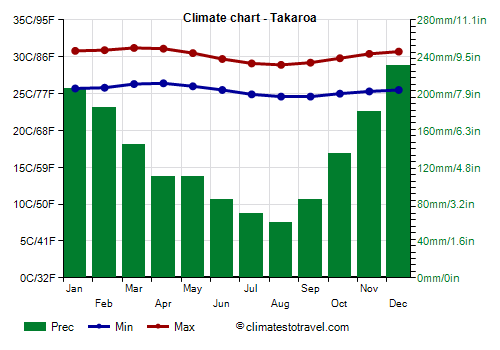
On the island of Takaroa, located in the northernmost part of the group, at 14 degrees south latitude, temperatures are high all year round, and do not drop below 20 °C (68 °F) even in the southern hemisphere winter.
Even here, however, the rains become rarer in winter, and from June to September they are lower than 100 mm (4 in) per month.
In Takaroa, the sun shines for a good number of hours all year round.
Hao
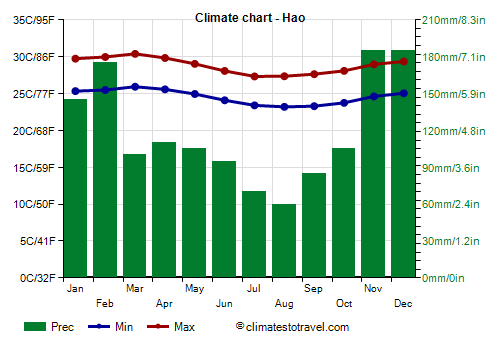
In the central part of the group, temperatures drop more noticeably in winter. However, it is still possible to go to the beach, also because it is the driest season of the year, and the sea is still warm.
On
Hao Island, located at 18 degrees south latitude, from July to September, highs are below 28 °C (82.5 °F).
Precipitation amounts to 1,400 mm (55 in) per year.
In the
southern part of the Tuamotus we find Mururoa atoll, now uninhabited. In this area, rainfall is slightly more abundant, in fact it amounts to 1,700 mm (67 in) per year, moreover, the temperatures in winter are a bit lower.
South of the Tuamotus lie the
Gambier Islands, which are associated with them administratively, but they are located more to the south and have a slightly different climate.
Austral Islands
The main group of the Austral Islands is that of the
Tubuai Islands (Tubuai, Rimatara, Rurutu, Raivavae, Îles Maria), which are located around the Tropic of Capricorn. For their southern location, it's useful to include in this group also the
Gambier Islands, which are the southernmost of the Tuamotu-Gambier administrative group and have a similar climate.
The Austral Islands are
cooler throughout the year: in the Tubuais and the Gambiers, the average temperature ranges from 26 °C (79 °F) in February to 21 °C (70 °F) in July and August. This means that the period from December to April is warm but not excessively, while the period from June to September, when daytime temperatures are around 24 °C (75 °F), can be a bit cool for swimming and sunbathing.
Tubuai
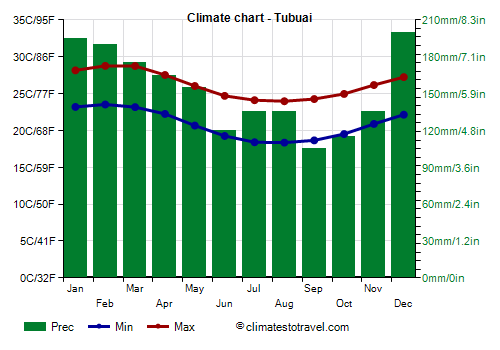
On the island of Tubuai, at 23 degrees south latitude, the daytime temperature does not exceed 24/25 °C (75/77 °F). Furthermore, from May to October there can be very cool periods, and cold records from July to September are around 11 °C (52 °F).
In addition, in the austral winter, they can be reached by disturbances brought by the flow of westerly winds, so on these islands,
the rains are frequent and relatively abundant even in the period from June to September. For example, in Rikitea, on the island of Mangareva (Gambier), in September, the driest month, still 115 mm (4.5 in) of rain fall. Objectively, it's difficult to find a better period for these islands.
On the Tubuai Islands, even the sun shines less often than on the islands located closer to the Equator.
The sea temperature on the Tubuai Islands also decreases in the winter months, although it remains all in all acceptable for swimming, since the water temperature drops to 23/23.5 °C (73/74 °F) from July to October.
Rapa
Much further to the south than the Tubuai and Gambier islands, we find other islands: Rapa Iti, the only inhabited one, and a group of four small volcanic islands called Marotiri or Bass Rocks.
These islands, the southernmost of the Austral Islands, are located at 27/28 degrees south latitude, and their
climate is cooler than that of the Tubuai group and the Gambiers. In addition, the rains are abundant throughout the year, and the wind is often intense. These islands do not lend themselves to beach tourism.
In
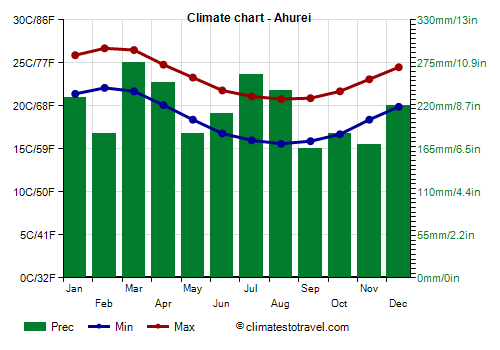
Ahurei, on the island of Rapa (Rapa Iti), the average daytime temperature ranges from 26.5 °C (79.5 °F) in February and March to 21 °C (70 °F) in the period from July to September.
From June to October, on the coldest nights the temperature typically drops to 12 °C (53.5 °F). In August 1979, it dropped to 9 °C (48 °F), and in September 2015, to 10 °C (50 °F). On the hottest days, the temperature typically reaches 29 °C (84 °F). In February 2002, it reached 31 °C (88 °F).
Precipitation in Rapa amounts to 2,500 mm (98 in) per year, and exceeds 150 mm (5.9 in) every month.
The sea in Rapa is warm enough for swimming from January to March, while it becomes very cool from May to October, with a temperature of 20.5/21 °C (69/70 °F).
Tropical cyclones
As mentioned, French Polynesia can be affected by the tropical cyclones of the South Pacific. In general, tropical cyclones are formed from November to April, although they are more frequent from December to March.
Since we are on the eastern edge in which cyclones are formed, they are
less frequent on these islands than on other islands of the Pacific. However, cyclones become much more likely in the more intense
El Niño years, as happened in 1982-83 and 1997-98.
When to go
The best time to visit the
Society Islands (Tahiti, Bora-Bora) and the
Tuamotu Islands runs from June to September, while the best time on the
Marquesas Islands runs from August to November.
In contrast, it's hard to find an advisable season for the
Austral Islands, in fact, the summer is hot and muggy, with heavy rains and thunderstorms as well as some risk of tropical cyclones, while the winter at this latitude is a bit cool, and even rainy and windy on the southernmost islands.
What to pack
For the
Marquesas, Society and Tuamotu Islands, all year round, bring tropics-friendly, loose-fitting clothing, a sun hat, a scarf for the breeze, a light sweatshirt for the evening, and a light raincoat or umbrella. When going to the reef, you can bring snorkeling equipment, including water shoes or rubber-soled shoes.
For the
Austral Islands, from June to September (ie in winter), bring light clothes for the day, a scarf for the breeze, a sweatshirt and possibly a light jacket for the evening, and a light raincoat or umbrella.
For
Rapa and the Bass Rocks, from June to September (ie in winter), bring spring/autumn clothes, a sweatshirt or sweater, a jacket, and a raincoat or umbrella; from December to February (ie in summer), light clothing, a sweatshirt for the evening, and a light raincoat or umbrella.
Climate data - French Polynesia
| Ahurei |
|---|
|
| Jan | Feb | Mar | Apr | May | Jun | Jul | Aug | Sep | Oct | Nov | Dec |
|---|
| Min temp. | 21 | 22 | 22 | 20 | 18 | 17 | 16 | 16 | 16 | 17 | 18 | 20 |
|---|
| Max temp. | 26 | 27 | 26 | 25 | 23 | 22 | 21 | 21 | 21 | 22 | 23 | 24 |
|---|
| Precip. | 230 | 185 | 275 | 250 | 185 | 210 | 260 | 240 | 165 | 185 | 170 | 220 |
|---|
| Prec. days | 13 | 12 | 15 | 15 | 14 | 16 | 15 | 16 | 13 | 12 | 12 | 13 |
|---|
|
|
|
| Sea temp | 24 | 25 | 25 | 23 | 22 | 21 | 20 | 20 | 21 | 21 | 22 | 23 |
|---|
| Atuona |
|---|
|
| Jan | Feb | Mar | Apr | May | Jun | Jul | Aug | Sep | Oct | Nov | Dec |
|---|
| Min temp. | 23 | 24 | 24 | 24 | 24 | 23 | 23 | 22 | 23 | 22 | 23 | 23 |
|---|
| Max temp. | 31 | 32 | 32 | 31 | 31 | 30 | 29 | 29 | 30 | 30 | 31 | 31 |
|---|
| Precip. | 145 | 110 | 155 | 150 | 140 | 145 | 140 | 125 | 80 | 90 | 90 | 70 |
|---|
| Prec. days | 13 | 12 | 14 | 14 | 14 | 14 | 16 | 15 | 12 | 13 | 12 | 10 |
|---|
|
|
| Sun hours | 8 | 8 | 8 | 8 | 7 | 6 | 7 | 7 | 7 | 8 | 8 | 8 |
|---|
| Sea temp | 28 | 28 | 29 | 29 | 28 | 28 | 28 | 27 | 27 | 27 | 28 | 28 |
|---|
| Bora Bora |
|---|
|
| Jan | Feb | Mar | Apr | May | Jun | Jul | Aug | Sep | Oct | Nov | Dec |
|---|
| Min temp. | 25 | 25 | 25 | 25 | 25 | 24 | 23 | 23 | 23 | 24 | 24 | 25 |
|---|
| Max temp. | 31 | 31 | 32 | 31 | 30 | 30 | 29 | 29 | 30 | 30 | 31 | 31 |
|---|
| Precip. | 250 | 220 | 150 | 130 | 190 | 90 | 120 | 70 | 90 | 120 | 190 | 260 |
|---|
| Prec. days | 15 | 14 | 13 | 12 | 14 | 9 | 11 | 8 | 9 | 11 | 15 | 15 |
|---|
|
|
| Sun hours | 6 | 7 | 8 | 7 | 7 | 7 | 7 | 8 | 8 | 7 | 7 | 7 |
|---|
| Sea temp | 29 | 29 | 29 | 29 | 28 | 28 | 27 | 27 | 27 | 27 | 28 | 28 |
|---|
| Hao |
|---|
|
| Jan | Feb | Mar | Apr | May | Jun | Jul | Aug | Sep | Oct | Nov | Dec |
|---|
| Min temp. | 25 | 25 | 26 | 26 | 25 | 24 | 23 | 23 | 23 | 24 | 25 | 25 |
|---|
| Max temp. | 30 | 30 | 30 | 30 | 29 | 28 | 27 | 27 | 28 | 28 | 29 | 29 |
|---|
| Precip. | 145 | 175 | 100 | 110 | 105 | 95 | 70 | 60 | 85 | 105 | 185 | 185 |
|---|
|
|
|
|
| Sea temp | 28 | 28 | 28 | 28 | 28 | 27 | 26 | 26 | 26 | 26 | 27 | 27 |
|---|
| Papeete |
|---|
|
| Jan | Feb | Mar | Apr | May | Jun | Jul | Aug | Sep | Oct | Nov | Dec |
|---|
| Min temp. | 24 | 24 | 25 | 24 | 23 | 22 | 22 | 22 | 22 | 23 | 24 | 24 |
|---|
| Max temp. | 31 | 31 | 32 | 32 | 31 | 30 | 29 | 29 | 29 | 30 | 31 | 31 |
|---|
| Precip. | 265 | 235 | 180 | 115 | 100 | 70 | 35 | 40 | 45 | 95 | 115 | 255 |
|---|
| Prec. days | 16 | 15 | 13 | 10 | 11 | 8 | 8 | 7 | 8 | 10 | 12 | 18 |
|---|
|
|
| Sun hours | 7 | 7 | 7 | 8 | 7 | 7 | 8 | 8 | 8 | 7 | 7 | 6 |
|---|
| Sea temp | 28 | 29 | 29 | 29 | 28 | 27 | 27 | 26 | 26 | 27 | 27 | 28 |
|---|
| Takaroa |
|---|
|
| Jan | Feb | Mar | Apr | May | Jun | Jul | Aug | Sep | Oct | Nov | Dec |
|---|
| Min temp. | 26 | 26 | 26 | 26 | 26 | 26 | 25 | 25 | 25 | 25 | 25 | 26 |
|---|
| Max temp. | 31 | 31 | 31 | 31 | 30 | 30 | 29 | 29 | 29 | 30 | 30 | 31 |
|---|
| Precip. | 205 | 185 | 145 | 110 | 110 | 85 | 70 | 60 | 85 | 135 | 180 | 230 |
|---|
| Prec. days | 17 | 15 | 14 | 11 | 11 | 11 | 10 | 9 | 10 | 13 | 15 | 17 |
|---|
|
|
| Sun hours | 7 | 8 | 8 | 8 | 8 | 7 | 8 | 8 | 8 | 8 | 8 | 7 |
|---|
|
| Tubuai |
|---|
|
| Jan | Feb | Mar | Apr | May | Jun | Jul | Aug | Sep | Oct | Nov | Dec |
|---|
| Min temp. | 23 | 24 | 23 | 22 | 21 | 19 | 18 | 18 | 19 | 20 | 21 | 22 |
|---|
| Max temp. | 28 | 29 | 29 | 28 | 26 | 25 | 24 | 24 | 24 | 25 | 26 | 27 |
|---|
| Precip. | 195 | 190 | 175 | 165 | 155 | 120 | 135 | 135 | 105 | 115 | 135 | 200 |
|---|
| Prec. days | 13 | 13 | 13 | 12 | 12 | 11 | 11 | 11 | 10 | 10 | 10 | 13 |
|---|
|
|
| Sun hours | 7 | 6 | 6 | 5 | 5 | 5 | 6 | 6 | 5 | 5 | 6 | 6 |
|---|
| Sea temp | 26 | 27 | 27 | 27 | 26 | 24 | 24 | 23 | 23 | 24 | 24 | 26 |
|---|
See also the
temperatures month by month