Select units of measurement for the temperature and rainfall tables (metric or imperial).
Average weather, temperature, rainfall, sunshine hours

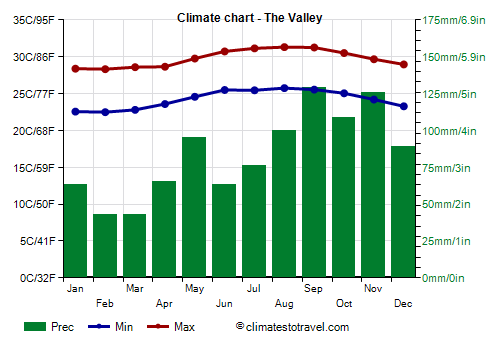
In The Valley, the capital of the small island state of Anguilla, there is a
tropical climate, with a slightly cooler period from December to March and a hotter, muggy period from May to October.
The
temperatures deviate slightly from the averages. At night, they can sometimes drop to 18/19 °C (64/66 °F) in winter, while during the day they can reach 32/33 °C (90/91 °F) from May to October.
Rainfall is relatively abundant and amounts to 1,000 millimeters (40 inches) per year. The rainiest period is from August to November.
From June to November,
tropical storms and hurricanes can arrive, with a greater probability from August to October.
The Valley - Climate data
In The Valley, the
average temperature of the coldest month (February) is of
25.4 °C, that of the warmest month (August) is of
28.5 °C. Here are the average temperatures.
The Valley - Average temperatures (2002-2020) |
| Month | Min | Max | Mean |
|---|
| January | 22.6 | 28.4 | 25.5 |
|---|
| February | 22.5 | 28.3 | 25.4 |
|---|
| March | 22.8 | 28.6 | 25.7 |
|---|
| April | 23.6 | 28.6 | 26.1 |
|---|
| May | 24.6 | 29.8 | 27.2 |
|---|
| June | 25.5 | 30.7 | 28.1 |
|---|
| July | 25.4 | 31.1 | 28.3 |
|---|
| August | 25.8 | 31.3 | 28.5 |
|---|
| September | 25.6 | 31.3 | 28.4 |
|---|
| October | 25 | 30.5 | 27.8 |
|---|
| November | 24.2 | 29.7 | 26.9 |
|---|
| December | 23.3 | 29 | 26.1 |
|---|
| Year | 24.2 | 29.8 | 26.95 |
|---|
amounts to
1000 millimeters per year: so, it is at an intermediate level. It ranges from
43 millimeters in the driest months (February, March) to
129 millimeters in the wettest one (September). Here is the average precipitation.
The Valley - Average precipitation| Month | Days |
|---|
| January | 63 | 10 |
|---|
| February | 43 | 8 |
|---|
| March | 43 | 7 |
|---|
| April | 65 | 8 |
|---|
| May | 95 | 10 |
|---|
| June | 63 | 8 |
|---|
| July | 76 | 9 |
|---|
| August | 100 | 12 |
|---|
| September | 129 | 13 |
|---|
| October | 109 | 12 |
|---|
| November | 126 | 13 |
|---|
| December | 89 | 12 |
|---|
| Year | 1000 | 122 |
|---|
The
sea temperature ranges from
26 °C in February, March to
29 °C in September, October. Here are the average sea temperatures.
The Valley - Sea temperature| Month |
|---|
| January | 26.5 |
|---|
| February | 26 |
|---|
| March | 26 |
|---|
| April | 26.5 |
|---|
| May | 27.5 |
|---|
| June | 28 |
|---|
| July | 28 |
|---|
| August | 28.5 |
|---|
| September | 29 |
|---|
| October | 29 |
|---|
| November | 28"> |
|---|
| December | 27 |
|---|
| Year | 27.6 |
|---|
There are on average around 3015
sunshine hours per year. Here are the average hours of sunshine per day.
The Valley - Sunshine hours| Month | Average | Total |
|---|
| January | 8 | 250 |
|---|
| February | 8 | 225 |
|---|
| March | 9 | 280 |
|---|
| April | 9 | 270 |
|---|
| May | 8 | 250 |
|---|
| June | 8 | 240 |
|---|
| July | 8 | 250 |
|---|
| August | 9 | 280 |
|---|
| September | 8 | 240 |
|---|
| October | 8 | 250 |
|---|
| November | 8 | 240 |
|---|
| December | 8 | 250 |
|---|
| Year | 8.3 | 3015 |
|---|