Select units of measurement for the temperature and rainfall tables (metric or imperial).
Average weather, temperature, rainfall, sunshine hours
Index
Introduction
In much of Florida, the climate is
sub-tropical, with mild winters (but subject to short cold spells) and hot, sunny summers. Summer, from June to September, is also muggy and with frequent thunderstorms.
In the southernmost part, the climate can instead be defined as
tropical, given that the average temperature in January exceeds 18 °C (64.5 °F).
In summer and early autumn, Florida is prone to hurricanes.
Florida is a state in southeastern United States, overlooking the Gulf of Mexico to the west and the Atlantic Ocean to the east, and extending from 24 to 31 degrees north latitude.
In summer,
temperatures are uniform from north to south, especially in the daytime, when they range between 31 °C and 33 °C (88 °F and 91 °F), while at night, they become warmer as you head south, in fact, they range from 21 °C (70 °F) in the far north to 27 °C (81 °F) in the Keys. On the contrary, temperatures in winter are very different: in January, the daily average ranges from 11 °C (52 °F) in the north to 21 °C (70 °F) in the far south. In summer, it's especially the high humidity that makes the heat uncomfortable, although periods of intense heat are also possible, with highs about 37/38 °C (99/100 °F). Afternoon breezes and thunderstorms give a bit of relief, otherwise, you can swim in the sea or take refuge in air-conditioned buildings.
In
winter, there are on average 8/9 days with rainfall in the north and 6/7 in the center-south. The rains are due to frontal systems, which are formed because of the clash of air masses, and may be accompanied by the wind, and sometimes by cold temperatures. The rare cold spells can occur from late November to mid-March.
In the northern part of Florida,
snow is rare but it can sometimes occur; in the central part (see Orlando), it's very rare, while in the south, which includes Miami, it practically never snows.
On winter nights, fog may form in the north.
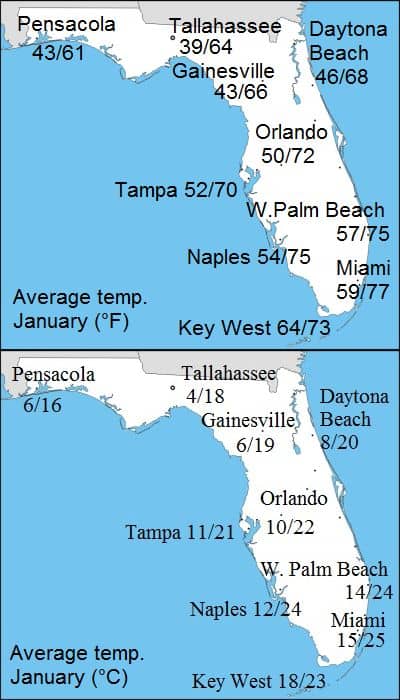
Here are the average minimum and maximum temperatures of January in some locations, both in Fahrenheit and Celsius degrees.
In
summer, it's often sunny, but some cloudiness can form, more or less extended, which can lead to thunderstorms, sometimes accompanied by wind gusts, and less frequently by hail. Fortunately, these thunderstorms do not last long, and quickly give way to the sun. Florida is the US state most affected by lightning.
Tornadoes in Florida are more common than in the Great Plains and in the Midwest of the United States, but they are generally much weaker. Sometimes, particularly intense tornadoes can occur in winter or spring because of abrupt intrusions of cold air.
The season of
hurricanes and tropical storms goes from June to November, although they are more likely from August to October. A particularly intense hurricane that hit Florida was the
Labor Day hurricane, in August-September 1935. The areas most at risk are the coastal ones because of storm surges coming from the sea.
The amount of
sunshine in Florida is very good all year round, and it is no surprise that the state nickname is "Sunshine State" (although, in reality, the deserts of California, Arizona and Nevada get more sunshine). The south is slightly sunnier than the north: the sun shines 70% of the time in Miami, 66% in Tampa, and 60% in Pensacola.
The sunniest months are March and April in the south and April and May in the north, while the least sunny season is winter, when, however, the sun often shines as well. In summer, as mentioned, the sky is not always clear: scattered clouds can form, and they can sometimes grow until they give rise to showers and thunderstorms, while later, the sun will come back.
The cities
Now, let's see in detail the climate of some cities, starting from the north.
Pensacola
In
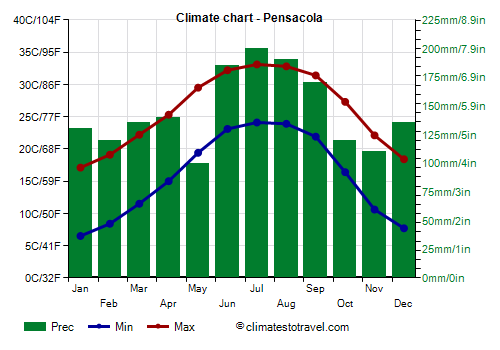
Pensacola, located in the northwest and overlooking the Gulf of Mexico, the average temperature ranges from 12 °C (53.5 °F) in January to 28.5 °C (83.5 °F) in July and August. Therefore, winter is not so mild, in addition, short cold spells are possible, and sometimes even frosts. The coldest record is as low as -15 °C (5 °F), and was set in January 1985.
Pensacola - Average temperatures (1991-2020) |
| Month | Min | Max | Mean |
|---|
| January | 6.5 | 17.1 | 11.8 |
|---|
| February | 8.4 | 19.1 | 13.8 |
|---|
| March | 11.5 | 22.2 | 16.8 |
|---|
| April | 15 | 25.3 | 20.2 |
|---|
| May | 19.4 | 29.5 | 24.4 |
|---|
| June | 23.1 | 32.2 | 27.6 |
|---|
| July | 24.1 | 33.1 | 28.6 |
|---|
| August | 23.9 | 32.8 | 28.4 |
|---|
| September | 21.9 | 31.4 | 26.6 |
|---|
| October | 16.4 | 27.3 | 21.8 |
|---|
| November | 10.6 | 22.1 | 16.4 |
|---|
| December | 7.7 | 18.4 | 13 |
|---|
| Year | 15.7 | 25.9 | 20.8 |
|---|
Rainfall amounts to 1,735 millimeters (68 inches) per year, and it's quite abundant even in winter, when it exceeds on average 100 mm (4 in) per month. Winter rains are due to the clash of air masses, which generate disturbances and draw mild and moist air from the Gulf of Mexico, while summer rains are mainly due to heat thunderstorms.
Pensacola - Average precipitation| Month | Days |
|---|
| January | 130 | 10 |
|---|
| February | 120 | 9 |
|---|
| March | 135 | 8 |
|---|
| April | 140 | 7 |
|---|
| May | 100 | 8 |
|---|
| June | 185 | 12 |
|---|
| July | 200 | 15 |
|---|
| August | 190 | 15 |
|---|
| September | 170 | 9 |
|---|
| October | 120 | 6 |
|---|
| November | 110 | 7 |
|---|
| December | 135 | 10 |
|---|
| Year | 1735 | 115 |
|---|
Pensacola was hit by Hurricane Ivan in September 2004, along with the neighbouring state of Alabama, while it was only brushed by Hurricane Katrina in the following year.
In the other northern cities of Florida (see
Tallahassee,
Jacksonville), the climate is similar to that of Pensacola.
Orlando
Continuing to the south, we arrive in
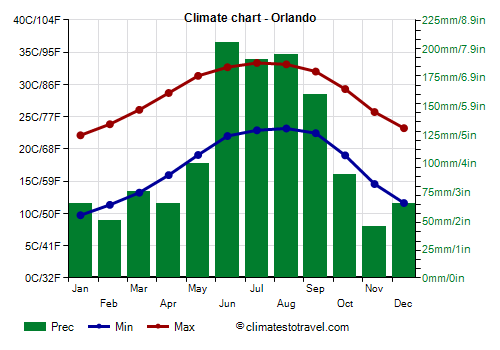
Orlando, at the center of the peninsula, where Disneyworld is also located. Here, winter is much milder, since the January average rises to 16 °C (61 °F). However, even here, short cold spells with slight frosts are sometimes possible, from November to March. Every so often, even snow can fall, although the only event with accumulation in the city occurred in 1948, and on the outskirts also in 1977.
Orlando - Average temperatures (1991-2020) |
| Month | Min | Max | Mean |
|---|
| January | 9.7 | 22.1 | 15.9 |
|---|
| February | 11.3 | 23.8 | 17.6 |
|---|
| March | 13.2 | 26.1 | 19.6 |
|---|
| April | 15.9 | 28.7 | 22.3 |
|---|
| May | 19.1 | 31.3 | 25.2 |
|---|
| June | 22 | 32.7 | 27.3 |
|---|
| July | 22.9 | 33.3 | 28.1 |
|---|
| August | 23.2 | 33.1 | 28.1 |
|---|
| September | 22.4 | 32 | 27.2 |
|---|
| October | 19 | 29.3 | 24.1 |
|---|
| November | 14.6 | 25.7 | 20.1 |
|---|
| December | 11.6 | 23.2 | 17.4 |
|---|
| Year | 17.1 | 28.5 | 22.75 |
|---|
In Orlando, as generally happens in central and southern Florida, winter is the least rainy season, in fact, 45 to 65 mm (1.8 to 2.6 in) of rain fall per month from November to February. Summer is, as usual, the rainiest season because of thunderstorms, but also because of the contribution given by hurricanes: rainfall exceeds 150 mm (6 in) per month from June to September.
Orlando - Average precipitation| Month | Days |
|---|
| January | 65 | 7 |
|---|
| February | 50 | 6 |
|---|
| March | 75 | 7 |
|---|
| April | 65 | 6 |
|---|
| May | 100 | 8 |
|---|
| June | 205 | 16 |
|---|
| July | 190 | 17 |
|---|
| August | 195 | 17 |
|---|
| September | 160 | 14 |
|---|
| October | 90 | 8 |
|---|
| November | 45 | 6 |
|---|
| December | 65 | 7 |
|---|
| Year | 1305 | 121 |
|---|
In
Tampa, located on the coast to the south-west of Orlando, and in Bradenton, south of Tampa, the climate is similar.
Miami
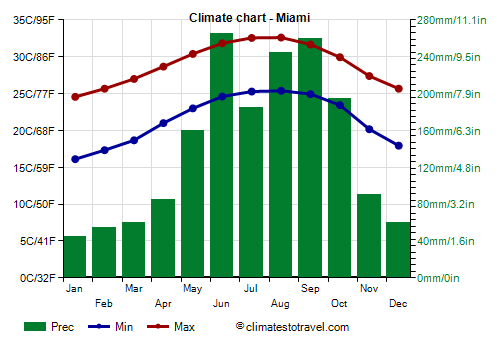
Further south, we enter an area where cold waves in winter are very rare, and in any case, they are less intense, and only bring a bit cold at night. In this area, the climate can already be described as tropical. In West Palm Beach, the average in January is 19 °C (66 °F), and in
Miami, it reaches 20 °C (68 °F).
Miami - Average temperatures (1991-2020) |
| Month | Min | Max | Mean |
|---|
| January | 16.1 | 24.6 | 20.3 |
|---|
| February | 17.3 | 25.7 | 21.5 |
|---|
| March | 18.7 | 27 | 22.8 |
|---|
| April | 21 | 28.7 | 24.8 |
|---|
| May | 23 | 30.4 | 26.7 |
|---|
| June | 24.6 | 31.8 | 28.2 |
|---|
| July | 25.3 | 32.6 | 28.9 |
|---|
| August | 25.4 | 32.6 | 29 |
|---|
| September | 24.9 | 31.7 | 28.3 |
|---|
| October | 23.4 | 29.9 | 26.7 |
|---|
| November | 20.2 | 27.4 | 23.8 |
|---|
| December | 17.9 | 25.7 | 21.8 |
|---|
| Year | 21.5 | 29 | 25.2 |
|---|
South of Miami, in the Keys, the temperature during the day is similar, but it's even higher at night: in Key West, lows range from 18.5 °C (65.5 °F) in January to 27 °C (80.5 °F) in July.
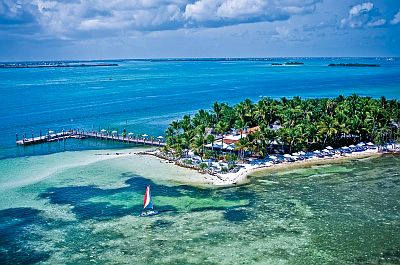
Sea temperature
In the northernmost part of the Gulf of Mexico (see Pensacola), the
sea is warm enough for swimming from May to November, and becomes very warm from June to September, while it is a bit cold in winter, and drops to 17.5/18.5 °C (63/65 °F) from January to March.
Pensacola - Sea temperature| Month |
|---|
| January | 18.5 |
|---|
| February | 17.5 |
|---|
| March | 18.5 |
|---|
| April | 20.5 |
|---|
| May | 24.5 |
|---|
| June | 28 |
|---|
| July | 29.5 |
|---|
| August | 29.5 |
|---|
| September | 28.5 |
|---|
| October | 25.5 |
|---|
| November | 22.5"> |
|---|
| December | 20 |
|---|
| Year | 23.6 |
|---|
On the northeast coast (see Fernandina Beach), the Atlantic Ocean is warmer in the winter months, in fact, it does not drop below 21 °C (68 °F). To find similar temperatures on the west coast, you have to go down to the latitude of Tampa.
Fernandina Beach - Sea temperature| Month |
|---|
| January | 21 |
|---|
| February | 21 |
|---|
| March | 21 |
|---|
| April | 22 |
|---|
| May | 25 |
|---|
| June | 27 |
|---|
| July | 28 |
|---|
| August | 29 |
|---|
| September | 28 |
|---|
| October | 26 |
|---|
| November | 24"> |
|---|
| December | 23 |
|---|
| Year | 24.6 |
|---|
To find acceptable sea temperatures even in winter, about 23/24 °C (73/75 °F), you have to go to the southern part of the west coast (see Marco Island), while on the east coast, these temperatures are found already at the latitude of Orlando (see Cape Canaveral). In Miami, in the south-east, the sea is just warmer than in Cape Canaveral.
Miami - Sea temperature| Month |
|---|
| January | 23.5 |
|---|
| February | 23.5 |
|---|
| March | 24 |
|---|
| April | 25 |
|---|
| May | 27 |
|---|
| June | 28.5 |
|---|
| July | 29.5 |
|---|
| August | 30 |
|---|
| September | 29.5 |
|---|
| October | 28 |
|---|
| November | 26"> |
|---|
| December | 25 |
|---|
| Year | 26.7 |
|---|
Best Time
The
best time to visit South Florida and Miami is from December to April. In winter, Miami is definitely the warmest and most sheltered place throughout the United States, and there are many sunny days, however, even here, sometimes there can be cool and windy conditions, as well as some rain.
In the center-north, where the risk of cold and rainy weather is higher, you can choose spring and autumn, ie March-April and October-November, although hurricanes are possible in autumn.
As previously mentioned, in the south, the sea is warm enough for swimming even in winter, although the weather is not always ideal: it can sometimes get cool, and even a little cold; hence, you can choose the period from mid-March to late April. In May, the heat begins to be felt and thunderstorms become more frequent, but you can still go for a beach holiday. Of course, you could also go in the long summer, but the heat is sweltering, and there is also the risk of hurricanes.
Back to topSee also the
temperatures by month.