Select units of measurement for the temperature and rainfall tables (metric or imperial).
Average weather, temperature, rainfall, sunshine hours

The climate of Daytona Beach is
subtropical, with very mild winters (though characterized by short cold waves) and hot, humid summers, during which there are quite frequent thunderstorms.
The city is located on the east coast of
Florida. Nearby are locations such as Ormond Beach and Port Orange.
The
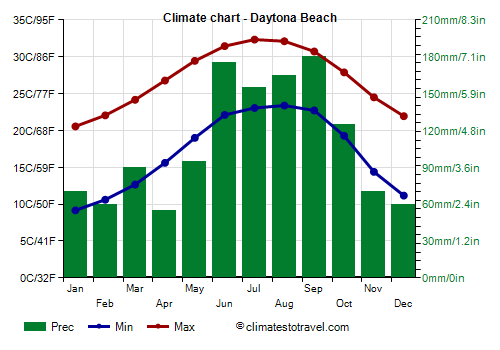
average temperature of the coldest month (January) is of 14.9 °C (59 °F), that of the warmest months (July, August) is of 27.7 °C (82 °F).
Precipitation amounts to 1,300 millimeters (51.3 inches) per year.
The
winter, from December to February, is very mild and sunny.
The rains are quite rare, although depending on the year, when it rains, it can rain a lot.
There are several warm periods, in which the temperature reaches or exceeds 25 °C (77 °F). However, after sunset the temperature drops a lot, and at night, it can get cold and fog can form.
In addition,
short cold spells can sometimes occur, when the minimum temperature drops to freezing or below. The record is -9.5 °C (15 °F), recorded in January 1985.
Snow in Daytona Beach is extremely rare. Occasionally, as in January 1977 and December 1989, light snowfalls can occur.

The
summer, from June to September, is hot and muggy. Due to high humidity, the heat is sweltering. The combination of humidity and temperature can produce a perceived temperature of 40 °C (104 °F) and above.
On the hottest days of the year, the temperature usually reaches 36 °C (97 °F). The record is 39 °C (102 °F), recorded in July 1981.
The sun often shines, but the sky is not always clear, as cloud coverings can form, which can give rise to thunderstorms. In summer, thunderstorms break almost every day, although it doesn't always rain. There can also be hail and gusts of wind.
Between late summer and early autumn, Daytona Beach can be affected by
hurricanes or tropical storms. Hurricane season runs from June to November, although the period in which they are most likely is from August to October. Indeed, the city has been hit several times over the past few decades, albeit not in a destructive way. Hurricanes can cause extensive damage, especially along the coast.
In
spring and autumn, from March to May and from early October to late November, it is generally warm to hot and sunny. The rains are not very frequent, although in October there are still 11 days with rain.
In May and October it is almost as hot as in summer, even though the humidity is lower and the rains are less frequent.
In March and November, on the other hand, there can be outbreaks of cold air that can bring a bit of cold at night.
The
sea temperature ranges between 20.5 °C (69 °F) and 28.5 °C (83.5 °F). The sea is warm enough for swimming from May to November. In winter, it is a bit cool.
Occasionally, Daytona Beach can be hit by a
tornado. Tornadoes are more likely in spring, and somewhat less in autumn, but in these southern latitudes, they can also occur in January and February.
Best Time
To visit Daytona Beach you can choose the period from mid-March to mid-April.
To go to the beach, the weather in May is generally excellent, with fewer thunderstorms than in summer, however, it can sometimes get a little cold at night.
Daytona Beach - Climate data
In Daytona Beach, the
average temperature of the coldest month (January) is of
14.9 °C, that of the warmest month (August) is of
27.7 °C. Here are the average temperatures.
Daytona Beach - Average temperatures (1991-2020) |
| Month | Min | Max | Mean |
|---|
| January | 9.2 | 20.6 | 14.9 |
|---|
| February | 10.6 | 22.1 | 16.3 |
|---|
| March | 12.7 | 24.2 | 18.4 |
|---|
| April | 15.6 | 26.8 | 21.2 |
|---|
| May | 19 | 29.4 | 24.2 |
|---|
| June | 22.1 | 31.4 | 26.8 |
|---|
| July | 23.1 | 32.3 | 27.7 |
|---|
| August | 23.4 | 32.1 | 27.7 |
|---|
| September | 22.7 | 30.7 | 26.7 |
|---|
| October | 19.3 | 27.9 | 23.6 |
|---|
| November | 14.4 | 24.5 | 19.4 |
|---|
| December | 11.2 | 21.9 | 16.6 |
|---|
| Year | 17 | 27 | 21.95 |
|---|
amounts to
1300 millimeters per year: it is therefore quite abundant. It ranges from
55 millimeters in the driest month (April) to
180 millimeters in the wettest one (September). Here is the average precipitation.
Daytona Beach - Average precipitation| Month | Days |
|---|
| January | 70 | 8 |
|---|
| February | 60 | 7 |
|---|
| March | 90 | 8 |
|---|
| April | 55 | 6 |
|---|
| May | 95 | 7 |
|---|
| June | 175 | 15 |
|---|
| July | 155 | 14 |
|---|
| August | 165 | 15 |
|---|
| September | 180 | 14 |
|---|
| October | 125 | 11 |
|---|
| November | 70 | 7 |
|---|
| December | 60 | 8 |
|---|
| Year | 1300 | 119 |
|---|
The
sea temperature ranges from
20.5 °C in February to
28.5 °C in July, August. Here are the average sea temperatures.
Daytona Beach - Sea temperature| Month |
|---|
| January | 21 |
|---|
| February | 20.5 |
|---|
| March | 21 |
|---|
| April | 22.5 |
|---|
| May | 25 |
|---|
| June | 27.5 |
|---|
| July | 28.5 |
|---|
| August | 28.5 |
|---|
| September | 28 |
|---|
| October | 26.5 |
|---|
| November | 24"> |
|---|
| December | 22.5 |
|---|
| Year | 24.6 |
|---|
There are on average around 2985
sunshine hours per year. Here are the average hours of sunshine per day.
Daytona Beach - Sunshine hours| Month | Average | Total |
|---|
| January | 7 | 215 |
|---|
| February | 8 | 225 |
|---|
| March | 9 | 280 |
|---|
| April | 9 | 270 |
|---|
| May | 9 | 280 |
|---|
| June | 9 | 270 |
|---|
| July | 9 | 280 |
|---|
| August | 9 | 280 |
|---|
| September | 8 | 240 |
|---|
| October | 7 | 215 |
|---|
| November | 7 | 210 |
|---|
| December | 7 | 215 |
|---|
| Year | 8.2 | 2985 |
|---|