Select units of measurement for the temperature and rainfall tables (metric or imperial).
Average weather, temperature, rainfall, sunshine hours
Index
Introduction
In Navarre, an autonomous community and province of northern Spain, there are the following climatic zones:
- in the north-west, we find an area influenced by the Atlantic Ocean, cool and humid, which is occupied by hills and low mountains belonging to the Cantabrian relief and by green valleys;
- in the north-east, the Pyrenean area, along the border with France, cold because of altitude, which receives snowfalls in winter and thunderstorms in summer;
- in the central part, an intermediate zone, slightly continental and moderately rainy, where Pamplona is located;
- in the south, an arid area, with slightly cold winters and hot summers. Here, we also find a lowland area: in the Ebro Valley, the altitude drops below 300 meters (1,000 feet).
However, Navarre is a battleground between
different air masses, so there can be sudden changes in temperature and strong winds. In winter, there can be snow and frost (especially in the north and in the mountains), while in summer, there can be very hot periods (especially in the central-southern part).
Precipitation is abundant in the north, where it exceeds 1,500 millimeters (60 inches) per year, and in some cases, as many as 2,000 mm (80 in), while it becomes progressively scarcer as you head south. Pamplona is located in the intermediate band, where precipitation ranges from 700 to 1,000 mm (27 to 40 in) per year. In the south, precipitation drops below 600 mm (23.5 in), and in the southernmost part, which is definitely arid (see Tudela), even below 400 mm (16 in).
Let's start from the
north, the area affected by the Atlantic Ocean. In the valleys located at low altitude, around sea level, winter is mild and summer is pleasantly warm.
Lesaka
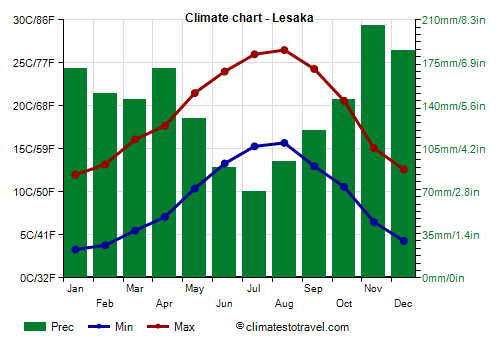
In
Lesaka, a small town located in a valley a few kilometers from the border with France, even though the climate is generally mild, snow and frost are possible in winter, while in summer, there can be very hot days, maybe only a day or two in a whole month, with highs of 38/40 °C (100/104 °F). The cold record is -12 °C (10.5 °F), the heat record is 41 °C (106 °F).
Here are the average temperatures.
Lesaka - Average temperatures (1981-2010) |
| Month | Min | Max | Mean |
|---|
| January | 3.3 | 12 | 7.6 |
|---|
| February | 3.8 | 13.2 | 8.5 |
|---|
| March | 5.5 | 16.1 | 10.8 |
|---|
| April | 7.1 | 17.7 | 12.4 |
|---|
| May | 10.4 | 21.5 | 16 |
|---|
| June | 13.3 | 24 | 18.6 |
|---|
| July | 15.3 | 26 | 20.6 |
|---|
| August | 15.7 | 26.5 | 21.1 |
|---|
| September | 13 | 24.3 | 18.6 |
|---|
| October | 10.6 | 20.6 | 15.6 |
|---|
| November | 6.5 | 15.1 | 10.8 |
|---|
| December | 4.3 | 12.6 | 8.4 |
|---|
| Year | 9.1 | 19.2 | 14.1 |
|---|
In Lesaka, the rains are plentiful, since they reach 1,670 mm (65.7 in), and are frequent throughout the year. Summer is the least rainy season.
Lesaka - Average precipitation| Month | Days |
|---|
| January | 170 | 13 |
|---|
| February | 150 | 12 |
|---|
| March | 145 | 13 |
|---|
| April | 170 | 16 |
|---|
| May | 130 | 14 |
|---|
| June | 90 | 12 |
|---|
| July | 70 | 11 |
|---|
| August | 95 | 12 |
|---|
| September | 120 | 12 |
|---|
| October | 145 | 13 |
|---|
| November | 205 | 14 |
|---|
| December | 185 | 14 |
|---|
| Year | 1675 | 155 |
|---|
At higher altitudes, both in the Cantabrian area and in the Pyrenees, the temperature decreases. The highest point of Navarre is
Mesa de los Tres Reyes, 2,428 meters (7,966 feet) high, on the border with France.
Abaurregaina
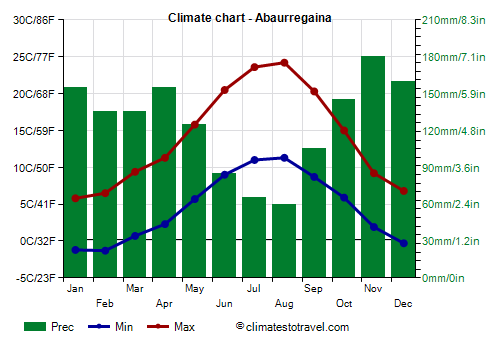
In
Abaurrea Alta (Abaurregaina in Basque), situated at 1,050 meters (3,450 ft), in the northeast, in the Pyrenean area, at night the temperature can drop to 0 °C (32 °F) even in May and October, and to 3/5 °C (37/41) in summer. The records are -18 °C (-0.5 °F), set in January 1985, and 38 °C (100.5 °F), set in August 1987. Here are the average temperatures.
Abaurregaina - Average temperatures (1981-2010) |
| Month | Min | Max | Mean |
|---|
| January | -1.2 | 5.8 | 2.3 |
|---|
| February | -1.3 | 6.5 | 2.6 |
|---|
| March | 0.7 | 9.4 | 5 |
|---|
| April | 2.3 | 11.3 | 6.8 |
|---|
| May | 5.7 | 15.8 | 10.8 |
|---|
| June | 9 | 20.5 | 14.8 |
|---|
| July | 11 | 23.6 | 17.3 |
|---|
| August | 11.3 | 24.2 | 17.8 |
|---|
| September | 8.7 | 20.3 | 14.5 |
|---|
| October | 5.9 | 15 | 10.4 |
|---|
| November | 1.9 | 9.2 | 5.6 |
|---|
| December | -0.3 | 6.8 | 3.2 |
|---|
| Year | 4.5 | 14.1 | 9.25 |
|---|
In Abaurregaina, 1,505 mm (59 in) of rain or snow fall per year, with a minimum in August of 60 mm (2.4 in) and a maximum in November of 180 mm (7 in). There are on average 126 days with rainfall and 26 days with snowfall per year; snowfall usually occurs from November to April.
Abaurregaina - Average precipitation| Month | Days |
|---|
| January | 155 | |
|---|
| February | 135 | |
|---|
| March | 135 | |
|---|
| April | 155 | |
|---|
| May | 125 | |
|---|
| June | 85 | |
|---|
| July | 65 | |
|---|
| August | 60 | |
|---|
| September | 105 | |
|---|
| October | 145 | |
|---|
| November | 180 | |
|---|
| December | 160 | |
|---|
| Year | 1505 | |
|---|

We now come to the
central belt.
Pamplona
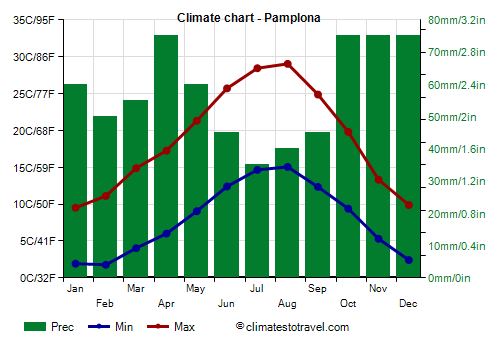
In the capital,
Pamplona, winter is cold enough: the average temperature in January is 5.5 °C (42 °F). There are mild periods, with daytime temperatures hovering around 12/15 °C (54/59 °F), however, the city is exposed to cold air outbreaks from Eastern Europe, which can bring snowfalls and frosts: there are on average 10 days with snowfalls (maybe light) per year. In January 1985, the temperature dropped to -15 °C (5 °F).
Summer is warm enough, the average of August being 22 °C (71.5 °F), and generally with cool nights, but the temperature undergoes considerable variations, both between night and day and from one day to another. Waves of intense heat are possible, during which the temperature can exceed 35 °C (95 °F), and sometimes it can reach as high as 40 °C (104 °F), but there are also pleasant and spring-like days, with highs around 20 °C (68 °F), when nights can be very cool, below 10 °C (50 °F), especially in June.
Here are the average temperatures.
Pamplona - Average temperatures (1991-2020) |
| Month | Min | Max | Mean |
|---|
| January | 1.9 | 9.5 | 5.7 |
|---|
| February | 1.8 | 11.1 | 6.4 |
|---|
| March | 4 | 14.9 | 9.5 |
|---|
| April | 6 | 17.3 | 11.6 |
|---|
| May | 9 | 21.3 | 15.2 |
|---|
| June | 12.4 | 25.7 | 19.1 |
|---|
| July | 14.7 | 28.4 | 21.6 |
|---|
| August | 15.1 | 29 | 22 |
|---|
| September | 12.4 | 24.9 | 18.6 |
|---|
| October | 9.4 | 19.8 | 14.6 |
|---|
| November | 5.3 | 13.3 | 9.3 |
|---|
| December | 2.4 | 9.9 | 6.2 |
|---|
| Year | 7.9 | 18.8 | 13.35 |
|---|
In Pamplona, 700 mm (27.5 in) of rain (or snow) fall per year. The wettest seasons are spring and autumn; summer is the least rainy season, but it is not so dry, since some rains or thunderstorms can occasionally occur.
Pamplona - Average precipitation| Month | Days |
|---|
| January | 60 | 10 |
|---|
| February | 50 | 9 |
|---|
| March | 55 | 8 |
|---|
| April | 75 | 10 |
|---|
| May | 60 | 10 |
|---|
| June | 45 | 6 |
|---|
| July | 35 | 4 |
|---|
| August | 40 | 5 |
|---|
| September | 45 | 6 |
|---|
| October | 75 | 9 |
|---|
| November | 75 | 10 |
|---|
| December | 75 | 11 |
|---|
| Year | 700 | 97 |
|---|
The amount of
sunshine in Navarre is not very good in the north, where cloudy days are frequent throughout the year (although there are 7/8 hours of sunshine per day in summer); in Pamplona, it's good in summer (in fact, there are 10 hours of sunshine per day in July), and even more so in the south, where sunny days are frequent throughout the year, but especially in summer.
Pamplona - Sunshine hours| Month | Average | Total |
|---|
| January | 3 | 95 |
|---|
| February | 4.5 | 125 |
|---|
| March | 5.5 | 175 |
|---|
| April | 6 | 185 |
|---|
| May | 7.5 | 230 |
|---|
| June | 9 | 270 |
|---|
| July | 10 | 310 |
|---|
| August | 9 | 280 |
|---|
| September | 7.5 | 220 |
|---|
| October | 5.5 | 165 |
|---|
| November | 3.5 | 110 |
|---|
| December | 3 | 90 |
|---|
| Year | 6.2 | 2245 |
|---|
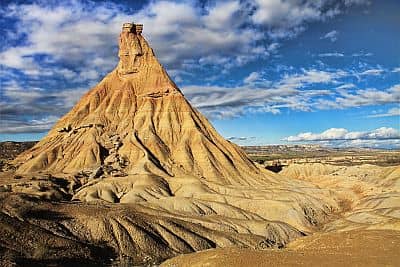
We come now to the
south. Here, the summer is hot, and the rains are much more scarce, so much so that there is also a semi-desert area, with a lunar landscape, called
Bardenas Reales.
Tudela
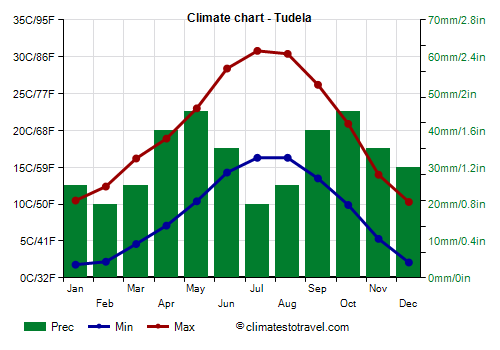
In
Tudela, located in the Ebro Valley, in summer, very hot days, with highs around or above 35 °C (95 °F), are quite frequent. As for the extreme values, from late November to early March, the temperature dropped to -6/-9 °C (16/21 °F), while from mid-June to early September, it reached 39/41 °C (102/106 °F).
Tudela - Average temperatures (1997-2020) |
| Month | Min | Max | Mean |
|---|
| January | 1.8 | 10.5 | 6.2 |
|---|
| February | 2.2 | 12.4 | 7.3 |
|---|
| March | 4.6 | 16.2 | 10.4 |
|---|
| April | 7.1 | 18.9 | 13 |
|---|
| May | 10.4 | 23 | 16.7 |
|---|
| June | 14.3 | 28.4 | 21.4 |
|---|
| July | 16.3 | 30.8 | 23.6 |
|---|
| August | 16.3 | 30.4 | 23.4 |
|---|
| September | 13.5 | 26.2 | 19.8 |
|---|
| October | 9.9 | 20.9 | 15.4 |
|---|
| November | 5.3 | 14 | 9.6 |
|---|
| December | 2.1 | 10.3 | 6.2 |
|---|
| Year | 8.7 | 20.2 | 14.4 |
|---|
In Tudela, precipitation amounts to only 380 mm (15 in) per year; on average, it does not reach 50 mm (2 in) in any month, and the winter is particularly dry, while in summer, some thunderstorms can occasionally break out.
Tudela - Average precipitation| Month | Days |
|---|
| January | 25 | 9 |
|---|
| February | 20 | 6 |
|---|
| March | 25 | 8 |
|---|
| April | 40 | 9 |
|---|
| May | 45 | 9 |
|---|
| June | 35 | 7 |
|---|
| July | 20 | 4 |
|---|
| August | 25 | 5 |
|---|
| September | 40 | 7 |
|---|
| October | 45 | 10 |
|---|
| November | 35 | 10 |
|---|
| December | 30 | 8 |
|---|
| Year | 380 | 91 |
|---|
Best Time
The
best time to visit Navarre, at least in the north, is the summer, from June to August or the first half of September, since it is the driest and sunniest period of the year. July and August are the warmest and least rainy months. You must take into account some rain in midsummer as well, and some nights a little cool in the valleys, and a little cold in hill areas.
In Pamplona, in July and August, you can find warm weather during the day, with cool nights, but there are also hot days, so you may prefer June and September.
In the south, which in summer can be very hot, you can go in spring and autumn, especially in May and from mid-September to mid-October, even though it rains more often.
Back to topSee also the
temperatures by month.