Select units of measurement for the temperature and rainfall tables (metric or imperial).
Average weather, temperature, rainfall, sunshine hours

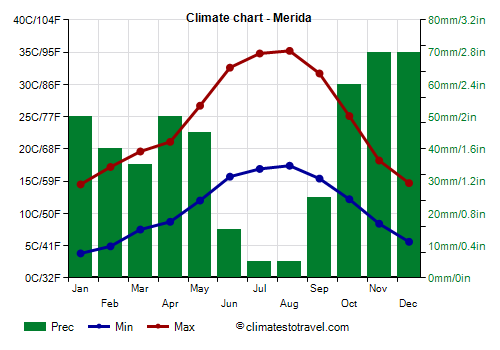
The climate of Mérida can be defined as Mediterranean, even though winter nights are often cold, while the summer is particularly hot.
The city is located in the southwest of Spain, in
Extremadura (of which it is the capital), 215 meters (705 feet) above sea level, and is crossed by the Guadiana River, which then heads towards Badajoz.
The
average temperature of the coldest month (January) is of 9.2 °C (48.5 °F), that of the warmest month (August) is of 26.3 °C (79.3 °F).
Precipitation amounts to 470 millimeters (18.5 inches) per year.
Winter, from December to February, is mild.
There are many sunny days, in which the air is mild during the day, but it can get cold at night. Also, in periods of good weather, fog can form at night and in the early morning.
However, there are also periods of bad weather, with wind and rain.
Very
cold days are rare, however, due to the distance from the sea, there may be light frosts at night. On the coldest nights of the year, the temperature generally drops to -3/-4 °C (25/27 °F).
Snow in Mérida is very rare, because when it is cold there are no bad weather conditions, while the humid currents from the Atlantic are also mild. However, snow fell in February 1983 and January 2010.
Summer, from June to mid-September, is very hot and sunny, with very rare rains.
Highs are usually about 35 °C (95 °F) in July and August, however, there are periods of scorching heat. On the hottest days of the year, the temperature normally reaches 41/42 °C (106/108 °F).
In August 2003, the temperature even reached 46 °C (115 °F), while in July 2017 it reached 44.5 °C (112 °F). In July 2020, the average maximum was 38.9 °C (102 °F).
However, the humidity is not high, and the daily temperature range is considerable, so that nights usually bring a bit of relief.

Best Time
In order to avoid both the summer heat and the winter rains, the
best months to visit Mérida are April, May and October, though it can sometimes rain. Those who can stand the heat can also choose the summer, but they have to be prepared to stroll around the city with scorching heat.
In winter, you can find several pleasant days, sunny and spring-like, although it can get cold at night, and waves of bad weather are not excluded.
Merida - Climate data
In Merida, the
average temperature of the coldest month (January) is of
9.2 °C, that of the warmest month (August) is of
26.3 °C. Here are the average temperatures.
Merida - Average temperatures (1991-2020) |
| Month | Min | Max | Mean |
|---|
| January | 3.8 | 14.5 | 9.2 |
|---|
| February | 4.9 | 17.2 | 11 |
|---|
| March | 7.5 | 19.6 | 13.6 |
|---|
| April | 8.7 | 21.1 | 14.9 |
|---|
| May | 12 | 26.7 | 19.4 |
|---|
| June | 15.7 | 32.6 | 24.2 |
|---|
| July | 16.9 | 34.8 | 25.8 |
|---|
| August | 17.4 | 35.2 | 26.3 |
|---|
| September | 15.4 | 31.7 | 23.6 |
|---|
| October | 12.2 | 25.1 | 18.6 |
|---|
| November | 8.4 | 18.2 | 13.3 |
|---|
| December | 5.6 | 14.7 | 10.1 |
|---|
| Year | 10.7 | 24.3 | 17.5 |
|---|
amounts to
470 millimeters per year: it is therefore quite scarce. It ranges from
5 millimeters in the driest months (July, August) to
70 millimeters in the wettest ones (November, December) Here is the average precipitation.
Merida - Average precipitation| Month | Days |
|---|
| January | 50 | 10 |
|---|
| February | 40 | 9 |
|---|
| March | 35 | 8 |
|---|
| April | 50 | 9 |
|---|
| May | 45 | 8 |
|---|
| June | 15 | 2 |
|---|
| July | 5 | 1 |
|---|
| August | 5 | 2 |
|---|
| September | 25 | 5 |
|---|
| October | 60 | 10 |
|---|
| November | 70 | 10 |
|---|
| December | 70 | 13 |
|---|
| Year | 470 | 86 |
|---|
There are on average around 2860
sunshine hours per year. Here are the average hours of sunshine per day.
Merida - Sunshine hours| Month | Average | Total |
|---|
| January | 4.5 | 145 |
|---|
| February | 6 | 165 |
|---|
| March | 7.5 | 225 |
|---|
| April | 8 | 245 |
|---|
| May | 9.5 | 290 |
|---|
| June | 11 | 335 |
|---|
| July | 12 | 375 |
|---|
| August | 11 | 340 |
|---|
| September | 8.5 | 260 |
|---|
| October | 6.5 | 205 |
|---|
| November | 5 | 155 |
|---|
| December | 3.5 | 115 |
|---|
| Year | 7.8 | 2860 |
|---|