Select units of measurement for the temperature and rainfall tables (metric or imperial).
Average weather, temperature, rainfall, sunshine hours
Index
Introduction
In the autonomous community of Galicia, located in north-western Spain, the climate is different from what is normally expected in Spain, in fact, it is
mild oceanic, with relatively mild, rainy winters and cool, quite sunny summers.
The
wind blows frequently, and can be stormy in the cold season, in fact, there are several beaches frequented by surfers.
Fog is also common: it can present itsfelf all year round, when there is no wind, even on summer nights.
Snowfalls are only sporadic on the coast (where it snowed in February 1963, in December 1970, and in January 1987); they are rare (once or twice a year) in the lowlands of the interior, while they are abundant in the mountains during winter.
In summer,
short heat waves are possible, with highs around or above 35 °C (95 °F), except on the north coast.
Rainfall is usually abundant, since it exceeds 1,000 millimeters (40 inches) per year almost everywhere, while it is close to 2,000 mm (79 in) along the west coast and on the west-facing slopes. However, summer is the driest season, when the rains, though possible also in this season, become quite rare.
The amount of
sunshine in Galicia is good in the summer, when sunny days prevail, especially in the southern part (in July and August, there are approximately 8 hours of sunshine per day in La Coruña and in Santiago de Compostela, and up to 9/10 in Vigo and Pontevedra), while in the other seasons, and especially in late autumn and winter, the sky is often cloudy because of the prevalence of Atlantic depressions.
In the interior, there are
mountain ranges, where the climate gets colder with increasing altitude, and heavy snowfalls can occur in winter. There are also skilifts. The highest peak is Peña Trevinca, 2,124 meters (6,968 feet) high, in
Serra do Eixe, while the altitude exceeds 1,700 meters (5,600 ft) in
Serra de Queixa and
Sierra de Ancares.
The
coast is indented, and there are coves (called
rías) as well as islands. The most important islands are
Illa de Arousa (inside the
ría of the same name and in the province of Pontevedra), the
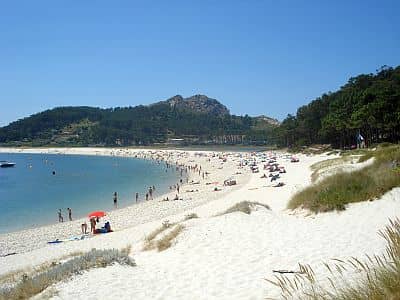
Cies Islands (off the coast of Vigo, where the famous
Praia das Rodas is located), and the
Ons Island (slightly to the north, and west of Pontevedra).
The most western point of Galicia and Spain is Cape Touriñán, just north of Cape Finisterre, which is traditionally (and wrongly) considered as the most westerly (although the difference is small). Owing to both the dangerousness of the coast and the frequent storms, which caused many shipwrecks in the course of history, this westernmost part of the coast is called
Costa da Morte (or
Costa de la Muerte in Castilian).
About fifty kilometers (30 miles) south-west of Santiago de Compostela, we find a large sandy beach, called
Dunas de Corrubedo, protected in a natural park.
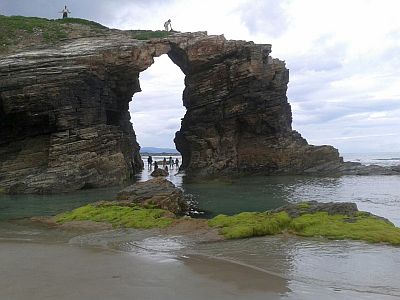
In the northeast, there is a beach, called
Praia das Catedrais or
Praia de Augas Santas, where you will find characteristic rocky arches.
The cities
La Coruña
On the northwest coast, in
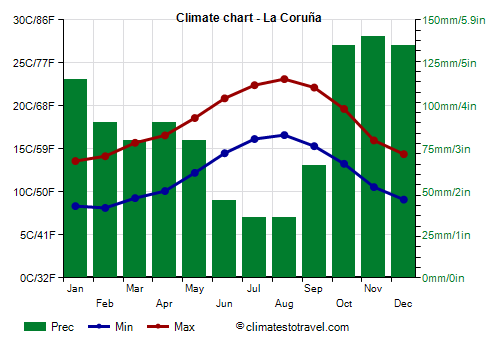
La Coruña, the climate is mild in winter, in fact the average for January and February is 11 °C (52 °F), while it remains cool in summer: highs in July and August are just around 22/23 °C (72/73 °F). Here are the average temperatures.
La Coruña - Average temperatures (1991-2020) |
| Month | Min | Max | Mean |
|---|
| January | 8.4 | 13.6 | 11 |
|---|
| February | 8.1 | 14.2 | 11.1 |
|---|
| March | 9.3 | 15.7 | 12.5 |
|---|
| April | 10.1 | 16.6 | 13.3 |
|---|
| May | 12.2 | 18.6 | 15.4 |
|---|
| June | 14.5 | 20.9 | 17.7 |
|---|
| July | 16.2 | 22.4 | 19.3 |
|---|
| August | 16.6 | 23.1 | 19.9 |
|---|
| September | 15.3 | 22.1 | 18.7 |
|---|
| October | 13.3 | 19.6 | 16.5 |
|---|
| November | 10.6 | 16 | 13.3 |
|---|
| December | 9.1 | 14.4 | 11.8 |
|---|
| Year | 12 | 18.1 | 15 |
|---|
In La Coruna, approximately 1,050 mm (41 in) of rain fall per year; the wettest seasons are autumn and winter, the least rainy is summer: from June to August, precipitation drops below 50 mm (2 in) per month, though it still rains for 6/7 days per month on average.
La Coruña - Average precipitation| Month | Days |
|---|
| January | 115 | 15 |
|---|
| February | 90 | 12 |
|---|
| March | 80 | 12 |
|---|
| April | 90 | 14 |
|---|
| May | 80 | 11 |
|---|
| June | 45 | 7 |
|---|
| July | 35 | 6 |
|---|
| August | 35 | 6 |
|---|
| September | 65 | 8 |
|---|
| October | 135 | 13 |
|---|
| November | 140 | 15 |
|---|
| December | 135 | 15 |
|---|
| Year | 1045 | 135 |
|---|
Further south, and in the interior, we find
Santiago de Compostela, which is a bit colder both because of the distance from the sea and of altitude, and it's also rainier, in fact, it receives nearly 1,900 mm (75 in) of rainfall per year.
Lugo
In
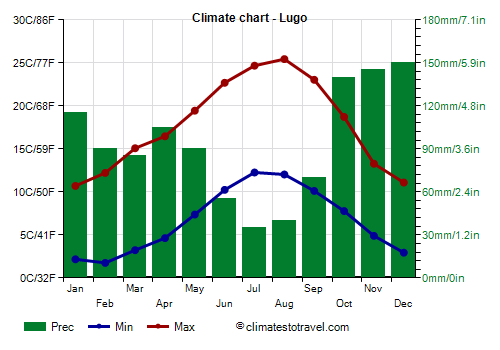
Lugo, located in the interior and at 450 meters (1,450 ft) of altitude, winter is colder, in fact the average in January drops to 6.5 °C (43.5 °F), and night frosts become quite frequent. In summer, days are pleasant, but nights remain cool.
Lugo - Average temperatures (1991-2020) |
| Month | Min | Max | Mean |
|---|
| January | 2.2 | 10.7 | 6.4 |
|---|
| February | 1.8 | 12.2 | 7 |
|---|
| March | 3.2 | 15.1 | 9.2 |
|---|
| April | 4.6 | 16.5 | 10.5 |
|---|
| May | 7.4 | 19.4 | 13.4 |
|---|
| June | 10.2 | 22.7 | 16.5 |
|---|
| July | 12.3 | 24.7 | 18.5 |
|---|
| August | 12 | 25.4 | 18.7 |
|---|
| September | 10.1 | 23 | 16.6 |
|---|
| October | 7.8 | 18.7 | 13.2 |
|---|
| November | 4.9 | 13.3 | 9.1 |
|---|
| December | 2.9 | 11.1 | 7 |
|---|
| Year | 6.6 | 17.8 | 12.2 |
|---|
In
Sarria, which is at no great distance from Lugo and practically at the same altitude, and it's often chosen as the starting point for the
Camino de Santiago (or Way of St. James), the temperatures are similar.
In Lugo, the rain pattern is very similar to that of La Coruna: rainfall amounts to 1.115 mm (44 in) per year, with a peak between October and January, when it exceeds 110 mm (4.3 in) per month, and a minimum in summer.
Lugo - Average precipitation| Month | Days |
|---|
| January | 115 | 14 |
|---|
| February | 90 | 12 |
|---|
| March | 85 | 12 |
|---|
| April | 105 | 14 |
|---|
| May | 90 | 13 |
|---|
| June | 55 | 7 |
|---|
| July | 35 | 5 |
|---|
| August | 40 | 6 |
|---|
| September | 70 | 8 |
|---|
| October | 140 | 14 |
|---|
| November | 145 | 15 |
|---|
| December | 150 | 15 |
|---|
| Year | 1115 | 135 |
|---|
Vigo
In the southwestern part of the coast, in cities such as
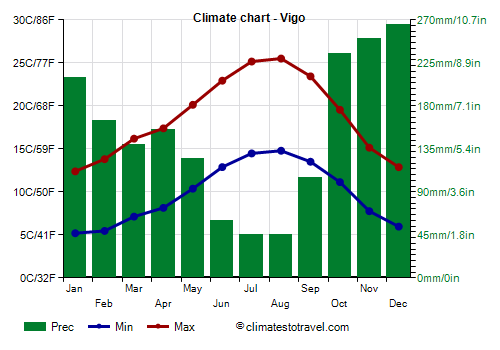
Vigo, the climate remains cool enough; inside the
rías, the temperature in winter is a bit lower than on the Atlantic coast, while in summer, it is a little higher.
In Vigo the average in January is 9 °C (48 °F).
Vigo - Average temperatures (1991-2020) |
| Month | Min | Max | Mean |
|---|
| January | 5.2 | 12.4 | 8.8 |
|---|
| February | 5.5 | 13.8 | 9.6 |
|---|
| March | 7.1 | 16.2 | 11.7 |
|---|
| April | 8.2 | 17.4 | 12.8 |
|---|
| May | 10.4 | 20.1 | 15.3 |
|---|
| June | 12.9 | 22.9 | 17.9 |
|---|
| July | 14.5 | 25.2 | 19.8 |
|---|
| August | 14.8 | 25.5 | 20.2 |
|---|
| September | 13.5 | 23.4 | 18.5 |
|---|
| October | 11.1 | 19.6 | 15.3 |
|---|
| November | 7.8 | 15.2 | 11.5 |
|---|
| December | 6 | 12.9 | 9.4 |
|---|
| Year | 9.8 | 18.7 | 14.2 |
|---|
Rainfall is particularly abundant on the coast exposed to the westerly winds: in Vigo, it reaches 1,800 mm (70 in) per year, including more than 200 mm (8 in) per month from October to January; sometimes, it reaches spectacular values. But even here, in summer, fortunately the rains diminish both in intensity and in frequency.
Vigo - Average precipitation| Month | Days |
|---|
| January | 210 | 14 |
|---|
| February | 165 | 12 |
|---|
| March | 140 | 12 |
|---|
| April | 155 | 14 |
|---|
| May | 125 | 12 |
|---|
| June | 60 | 7 |
|---|
| July | 45 | 5 |
|---|
| August | 45 | 5 |
|---|
| September | 105 | 8 |
|---|
| October | 235 | 13 |
|---|
| November | 250 | 14 |
|---|
| December | 265 | 15 |
|---|
| Year | 1805 | 131 |
|---|
In
Pontevedra, the climate is similar to that of Vigo.
Orense
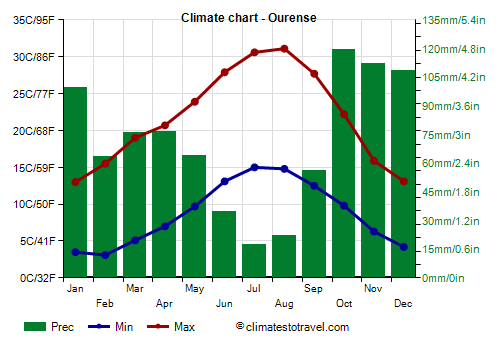
In the southeastern inland area of Galicia and at low altitude, the climate is almost Mediterranean, and it is quite hot in summer: in
Orense (or Ourense), 250 meters (800 ft) above sea level, highs in July and August reach 30/31 °C (86/88 °F), although nights remain cool.
Ourense - Average temperatures (1991-2020) |
| Month | Min | Max | Mean |
|---|
| January | 3.5 | 13 | 8.2 |
|---|
| February | 3.1 | 15.5 | 9.3 |
|---|
| March | 5.1 | 19 | 12 |
|---|
| April | 7 | 20.7 | 13.8 |
|---|
| May | 9.7 | 23.9 | 16.8 |
|---|
| June | 13.1 | 27.9 | 20.5 |
|---|
| July | 15 | 30.6 | 22.8 |
|---|
| August | 14.8 | 31.1 | 23 |
|---|
| September | 12.5 | 27.7 | 20.1 |
|---|
| October | 9.8 | 22.2 | 16 |
|---|
| November | 6.3 | 15.9 | 11.1 |
|---|
| December | 4.2 | 13.1 | 8.6 |
|---|
| Year | 8.7 | 21.8 | 15.2 |
|---|
In Orense, precipitation drops below 1,000 mm (40 in) per year, and in summer, the rains are quite rare.
Ourense - Average precipitation| Month | Days |
|---|
| January | 100 | 11 |
|---|
| February | 64 | 9 |
|---|
| March | 76 | 10 |
|---|
| April | 77 | 11 |
|---|
| May | 64 | 9 |
|---|
| June | 35 | 5 |
|---|
| July | 18 | 3 |
|---|
| August | 22 | 3 |
|---|
| September | 56 | 7 |
|---|
| October | 119 | 11 |
|---|
| November | 112 | 12 |
|---|
| December | 108 | 11 |
|---|
| Year | 850 | 101 |
|---|
North-east of Orense, we find the Sil River, which gives birth to the canyon of the same name.
Sea temperature
Along the coasts of Galicia, the sea temperature is 13/14 °C (55/57 °F) from January to April. The sea is a bit cold even in the height of summer, in fact it reaches a maximum of 18/19 °C (64/66 °F) from July to September. Here is the sea temperature in La Coruña.
La Coruña - Sea temperature| Month |
|---|
| January | 13 |
|---|
| February | 13 |
|---|
| March | 13 |
|---|
| April | 13 |
|---|
| May | 14 |
|---|
| June | 16 |
|---|
| July | 18 |
|---|
| August | 19 |
|---|
| September | 18 |
|---|
| October | 17 |
|---|
| November | 15"> |
|---|
| December | 14 |
|---|
| Year | 15.3 |
|---|
Best Time
The
best time to visit Galicia is the summer, from June to August or the first half of September, since it is the driest and sunniest period of the year. July and August are the warmest and least rainy months. However, it can sometimes rain even in midsummer, and some nights can be a bit cool on the coast and a bit cold in inland areas.
Those who don't like the heat, in order to avoid the albeit rare hot days, can choose the periods from mid-April to mid-June and from mid-September to mid-October, although, in these two periods, it rains more often than in summer.
In the summer, on sunny days (which are quite frequent, especially in the south-west), you can take a break at the beach and sunbathe, with an air temperature often pleasant and a cool breeze from the ocean, but, as mentioned, the sea is cold for swimming.
Back to topSee also the
temperatures by month.