![]() Climate chart - Chiredzi (Zimbabwe)
Climate chart - Chiredzi (Zimbabwe)
The climate of Chiredzi is
sub-tropical, tempered by altitude, with a hot, rainy season from November to March and a long dry season from April to October, within which there is a cool period from May to August. In the latter, it can get cold at night. During the day, it can get very hot from September to April.
The town is located in the south-east of Zimbabwe, in the province of Masvingo, at an altitude of 430 meters (1,410 feet).
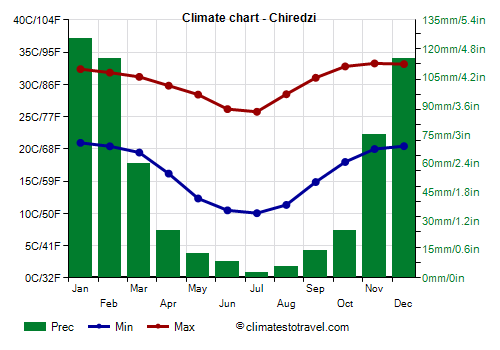
Chiredzi - Climate data
The
average temperature of the coldest month (July) is of 17.9 °C (64.2 °F), that of the warmest month (December) is of 26.8 °C (80.2 °F). Here are the average temperatures.
Chiredzi - Average temperatures (1991-2018) | Month | Min (°C) | Max (°C) | Mean (°C) | Min (°F) | Max (°F) | Mean (°F) |
|---|
| January | 20.9 | 32.4 | 26.7 | 70 | 90 | 80 |
|---|
| February | 20.4 | 31.8 | 26.1 | 69 | 89 | 79 |
|---|
| March | 19.4 | 31.2 | 25.3 | 67 | 88 | 77.5 |
|---|
| April | 16.2 | 29.8 | 23 | 61 | 86 | 73.4 |
|---|
| May | 12.3 | 28.4 | 20.4 | 54 | 83 | 68.7 |
|---|
| June | 10.5 | 26.2 | 18.3 | 51 | 79 | 65 |
|---|
| July | 10 | 25.8 | 17.9 | 50 | 78 | 64.2 |
|---|
| August | 11.3 | 28.5 | 19.9 | 52 | 83 | 67.8 |
|---|
| September | 14.9 | 31 | 23 | 59 | 88 | 73.3 |
|---|
| October | 18 | 32.8 | 25.4 | 64 | 91 | 77.7 |
|---|
| November | 20 | 33.3 | 26.6 | 68 | 92 | 79.9 |
|---|
| December | 20.4 | 33.2 | 26.8 | 69 | 92 | 80.2 |
|---|
| Year | 16.2 | 30.3 | 23.2 | 61.1 | 86.6 | 74 |
|---|
amounts to 585 millimeters (23 inches) per year: so, it is at an intermediate level. It ranges from 3 mm (0.1 in) in the driest month (July) to 125 mm (4.9 in) in the wettest one (January). Here is the average precipitation.
Chiredzi - Average precipitation| Month | Millimeters | Inches | Days |
|---|
| January | 125 | 4.9 | 10 |
|---|
| February | 115 | 4.5 | 10 |
|---|
| March | 60 | 2.4 | 8 |
|---|
| April | 25 | 1 | 4 |
|---|
| May | 13 | 0.5 | 3 |
|---|
| June | 9 | 0.3 | 3 |
|---|
| July | 3 | 0.1 | 2 |
|---|
| August | 6 | 0.2 | 2 |
|---|
| September | 14 | 0.6 | 3 |
|---|
| October | 25 | 1 | 5 |
|---|
| November | 75 | 3 | 8 |
|---|
| December | 115 | 4.5 | 10 |
|---|
| Year | 585 | 23 | 66 |
|---|
Chiredzi - Weather by month
Based on the period 1991-2018
January is generally a warm to hot month. The average temperature is of 26.7 °C (80 °F), with a minimum of 20.9 °C (69.7 °F) and a maximum of 32.4 °C (90.3 °F).

On the coldest nights of the month, the temperature usually drops to around 16.5 °C (62 °F).

On the warmest days of the month, the temperature usually reaches around 38.5 °C (101 °F). However, it reached 42.5 °C (108.5 °F) in January 2016.

Precipitation amounts to 125 mm (4.9 in), distributed over 10 days.
The day lasts on average 13 hours and 10 minutes.
The average humidity is 67%.
The average wind speed is 7 kph (5 mph).
February is generally a warm to hot month. The average temperature is of 26.1 °C (79 °F), with a minimum of 20.4 °C (68.7 °F) and a maximum of 31.8 °C (89.3 °F).
On the coldest nights of the month, the temperature usually drops to around 16 °C (60.5 °F).
On the warmest days of the month, the temperature usually reaches around 37.5 °C (99.5 °F). However, it reached 43.8 °C (110.8 °F) in February 1992.
Precipitation amounts to 115 mm (4.5 in), distributed over 10 days.
The day lasts on average 12 hours and 50 minutes.
The average humidity is 69%.
The average wind speed is 6 kph (4 mph).
March is generally a warm to hot month. The average temperature is of 25.3 °C (78 °F), with a minimum of 19.4 °C (67 °F) and a maximum of 31.2 °C (88.1 °F).
On the coldest nights, the temperature usually drops to around 15.5 °C (60 °F).
On the warmest days, the temperature usually reaches around 36.5 °C (97.5 °F). However, it reached 41.1 °C (106 °F) in March 2005.
Precipitation amounts to 60 mm (2.4 in), distributed over 8 days.
The day lasts on average 12 hours and 10 minutes.
The average humidity is 69%.
The average wind speed is 6 kph (3 mph).
April is generally a warm to hot month. However, there are remarkable differences between night and day. The average temperature is of 23.0 °C (73 °F), with a minimum of 16.2 °C (61.1 °F) and a maximum of 29.8 °C (85.7 °F).
On the coldest nights, which normally occur at the end of the month, the temperature usually drops to around 11.5 °C (52.5 °F).
On the warmest days, which normally occur at the beginning of the month, the temperature usually reaches around 36 °C (97 °F). However, it reached 38.9 °C (102 °F) in April 1993.
Precipitation amounts to 25 mm (1 in), distributed over 4 days.
The day lasts on average 11 hours and 35 minutes.
The average humidity is 65%.
The average wind speed is 4 kph (3 mph).
May is generally a warm month. However, there are remarkable differences between night and day. The average temperature is of 20.4 °C (69 °F), with a minimum of 12.3 °C (54.2 °F) and a maximum of 28.4 °C (83.2 °F).
On the coldest nights, which normally occur at the end of the month, the temperature usually drops to around 7.5 °C (45.5 °F).
On the warmest days, which normally occur at the beginning of the month, the temperature usually reaches around 34 °C (93.5 °F). However, it reached 39.6 °C (103.3 °F) in May 1998.
Precipitation amounts to 13 mm (0.5 in), distributed over 3 days.
The day lasts on average 11 hours and 5 minutes.
The average humidity is 60%.
The average wind speed is 4 kph (2 mph).
June is generally a warm month. However, there are remarkable differences between night and day. The average temperature is of 18.3 °C (65 °F), with a minimum of 10.5 °C (50.9 °F) and a maximum of 26.2 °C (79.1 °F).
On the coldest nights, the temperature usually drops to around 6 °C (42.5 °F).
On the warmest days, the temperature usually reaches around 32.5 °C (90 °F). However, it reached 35 °C (95 °F) in June 1998.
Precipitation amounts to only 9 mm (0.4 in), distributed over 3 days.
The day lasts on average 10 hours and 55 minutes. June 21, the winter solstice, is the shortest day of the year in the Southern Hemisphere.
The average humidity is 61%.
The average wind speed is 3 kph (2 mph).
July, the coldest month of the year, is generally a very mild month. However, there are remarkable differences between night and day. The average temperature is of 17.9 °C (64 °F), with a minimum of 10 °C (50.1 °F) and a maximum of 25.8 °C (78.4 °F).
On the coldest nights of the month, the temperature usually drops to around 5.5 °C (41.5 °F).
On the warmest days of the month, the temperature usually reaches around 32.5 °C (90 °F). However, it reached 36.2 °C (97.2 °F) in July 1994.
Precipitation amounts to only 3 mm (0.1 in), distributed over 2 days.
The day lasts on average 11 hours and 0 minutes.
The average humidity is 58%.
The average wind speed is 4 kph (3 mph).
August is generally a warm month. However, there are remarkable differences between night and day. The average temperature is of 19.9 °C (68 °F), with a minimum of 11.3 °C (52.4 °F) and a maximum of 28.5 °C (83.3 °F).
On the coldest nights of the month, the temperature usually drops to around 6 °C (42.5 °F).
On the warmest days of the month, the temperature usually reaches around 35.5 °C (96 °F). However, it reached 38.5 °C (101.3 °F) in August 1995.
Precipitation amounts to only 6 mm (0.2 in), distributed over 2 days.
The day lasts on average 11 hours and 25 minutes.
The average humidity is 52%.
The average wind speed is 6 kph (4 mph).
September is generally a warm to hot month. However, there are remarkable differences between night and day. The average temperature is of 23.0 °C (73 °F), with a minimum of 14.9 °C (58.8 °F) and a maximum of 31 °C (87.9 °F).
On the coldest nights, which normally occur at the beginning of the month, the temperature usually drops to around 9.5 °C (49 °F).
On the warmest days, which normally occur at the end of the month, the temperature usually reaches around 39.5 °C (103 °F). However, it reached 42.6 °C (108.7 °F) in September 1999.
Precipitation amounts to 14 mm (0.6 in), distributed over 3 days.
The day lasts on average 12 hours and 0 minutes.
The average humidity is 50%.
The average wind speed is 9 kph (5 mph).
October is generally a warm to hot month. However, there are remarkable differences between night and day. The average temperature is of 25.4 °C (78 °F), with a minimum of 18 °C (64.4 °F) and a maximum of 32.8 °C (91 °F).
On the coldest nights, which normally occur at the beginning of the month, the temperature usually drops to around 12 °C (53.5 °F).
On the warmest days, which normally occur at the end of the month, the temperature usually reaches around 41 °C (105.5 °F). However, it reached 44.5 °C (112.1 °F) in October 2017.
Precipitation amounts to 25 mm (1 in), distributed over 5 days.
The day lasts on average 12 hours and 35 minutes.
The average humidity is 52%.
The average wind speed is 10 kph (6 mph).
November is generally a warm to hot month. However, there are remarkable differences between night and day. The average temperature is of 26.6 °C (80 °F), with a minimum of 20 °C (68 °F) and a maximum of 33.3 °C (91.9 °F).
On the coldest nights, which normally occur at the beginning of the month, the temperature usually drops to around 15 °C (59 °F).
On the warmest days, which normally occur at the end of the month, the temperature usually reaches around 40.5 °C (105.5 °F). However, it reached 43.6 °C (110.5 °F) in November 2015.
Precipitation amounts to 75 mm (3 in), distributed over 8 days.
The day lasts on average 13 hours and 5 minutes.
The average humidity is 55%.
The average wind speed is 9 kph (6 mph).
December is generally a warm to hot month. The average temperature is of 26.8 °C (80 °F), with a minimum of 20.4 °C (68.8 °F) and a maximum of 33.2 °C (91.7 °F).
On the coldest nights of the month, the temperature usually drops to around 15 °C (59.5 °F).
On the warmest days of the month, the temperature usually reaches around 39.5 °C (102.5 °F). However, it reached 41.5 °C (106.7 °F) in December 2006.
Precipitation amounts to 115 mm (4.5 in), distributed over 10 days.
The day lasts on average 13 hours and 25 minutes. December 21, the summer solstice, is the longest day of the year in the Southern Hemisphere.
The average humidity is 60%.
The average wind speed is 8 kph (5 mph).