Select units of measurement for the temperature and rainfall tables (metric or imperial).
Average weather, temperature, rainfall, sunshine hours
In Isla de Margarita, a few kilometers (or miles) off the north coast of Venezuela, the climate is
tropical, hot and muggy all year round, with a dry season from late February to May and a rainy season, felt more or less depending on the area, from June to mid-February.
Temperatures are almost always above 30 °C (86 °F) during the day and above 20 °C (68 °F) at night. However, they are slightly lower from December to February, while owing to the zenith passages of the sun, they are higher two periods, in April-May and September-October, when they can reach 34/35 °C (93/95 °F). The sun passes directly overhead at noon around April 20 and August 20, and remains close to the zenith in the summer months, so you need appropriate protection in the central hours of the day.
Here are the average temperatures.
Isla Margarita - Average temperatures (1991-2020) |
| Month | Min | Max | Mean |
|---|
| January | 23.4 | 29.9 | 26.7 |
|---|
| February | 23.4 | 30.4 | 26.9 |
|---|
| March | 23.7 | 31.1 | 27.4 |
|---|
| April | 24.5 | 32.1 | 28.3 |
|---|
| May | 25.2 | 32.6 | 28.9 |
|---|
| June | 25 | 31.8 | 28.4 |
|---|
| July | 24.7 | 31.8 | 28.2 |
|---|
| August | 25 | 32.2 | 28.6 |
|---|
| September | 25.6 | 32.7 | 29.2 |
|---|
| October | 25.4 | 32.6 | 29 |
|---|
| November | 24.8 | 31.6 | 28.2 |
|---|
| December | 24 | 30.5 | 27.2 |
|---|
| Year | 24.6 | 31.6 | 28.05 |
|---|
The
wind blows throughout the year, tempering the heat, in the form of northeast trade winds in winter and of southeast trade winds in summer.
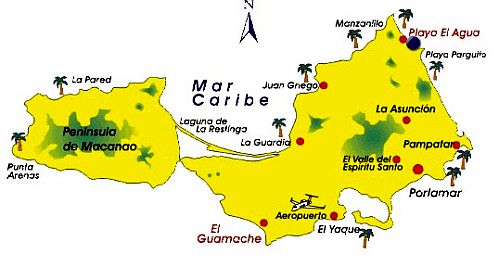
Precipitation is not abundant along the coasts and in low-lying areas, but there are important variations depending on the zone. Typically, the eastern part of the island (called Paraguachoa) is rainier than the western one (called Macanao Peninsula), and hilly areas are rainier than the plains.
The
rainy season, from June to mid-February, is actually divided into two: in the first part (June to October), there are long periods without rain, but thunderstorms can occasionally occur, sometimes intense; in the second part (November to mid-February), the rains are due to the northeast trade winds, and occur almost only in the eastern part of the island, and in particular, along the coast facing north-east: during some years, in this second period, there may be heavy rains and flooding.
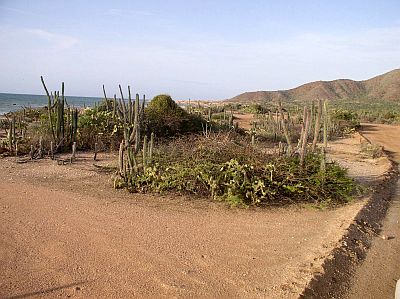
The result is that on the western and southern plains and coasts (see Punta de Piedras or the airport area, and much of the Macanao Peninsula), which are drier, the rainy season goes from June to mid October, peaking from June to August, when the rains are slightly higher than 100 millimeters (4 inches) per month; the rains are rare even in this period, but when they occur, they may be abundant. At the Airport, only 625 millimeters (24.5 inches) of rain fall per year.

On the contrary, in the
eastern side (see La Asunción, Playa Parguito, Playa el Agua), the summer rains are a bit scarcer, since they reach at most 75 mm (3 in) in August, but later, the rains become more abundant, from November to mid-February, when they hover from 95 to 130 mm (3.7 to 5.1 in) per month. In La Asunción, 770 mm (30 in) of rain fall per year, which is not much, but owing to the brevity of the dry season (the only months when it rains very little are March, April and May), the landscape is green.
Here is the average precipitation in
La Asunción, which is located in the east, ie the area more exposed to the rains caused by the northeast trade winds.
La Asunción - Average precipitation| Month | Days |
|---|
| January | 105 | 13 |
|---|
| February | 60 | 7 |
|---|
| March | 35 | 6 |
|---|
| April | 25 | 4 |
|---|
| May | 25 | 3 |
|---|
| June | 50 | 8 |
|---|
| July | 70 | 11 |
|---|
| August | 75 | 9 |
|---|
| September | 50 | 5 |
|---|
| October | 50 | 5 |
|---|
| November | 95 | 11 |
|---|
| December | 130 | 13 |
|---|
| Year | 770 | 95 |
|---|
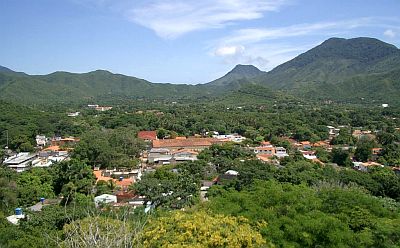
The greenest areas are the inland hills: the highest point is at 750 meters (2,450 feet) in the Macanao Peninsula (in fact, the only green part of the peninsula is the inland hilly area) and at 900 meters (3,000 feet) in Paraguachoa, where there is also a national park, the
Parque Nacional Cerro El Copey. In fact, hills and mountains enhance the formation of rain clouds.

The amount of
sunshine in Isla Margarita is good all year round, since good weather usually prevails. Here are the average sunshine hours per day.
Isla Margarita - Sunshine hours| Month | Average | Total |
|---|
| January | 8.5 | 265 |
|---|
| February | 9 | 255 |
|---|
| March | 9 | 275 |
|---|
| April | 8 | 245 |
|---|
| May | 8 | 250 |
|---|
| June | 7.5 | 220 |
|---|
| July | 7.5 | 235 |
|---|
| August | 8 | 250 |
|---|
| September | 8.5 | 250 |
|---|
| October | 8.5 | 260 |
|---|
| November | 9 | 265 |
|---|
| December | 8 | 255 |
|---|
| Year | 8.3 | 3025 |
|---|
The
sea is warm enough for swimming all year round, as you can see in the following table.
Isla Margarita - Sea temperature| Month |
|---|
| January | 26 |
|---|
| February | 25.5 |
|---|
| March | 26 |
|---|
| April | 26 |
|---|
| May | 26.5 |
|---|
| June | 27 |
|---|
| July | 27 |
|---|
| August | 28 |
|---|
| September | 28.5 |
|---|
| October | 28 |
|---|
| November | 28"> |
|---|
| December | 27 |
|---|
| Year | 27 |
|---|
The island, together with the two smaller islands of Cubagua and Coche, is part of the insular state of Nueva Esparta. The two smaller islands, flat and even closer to the mainland, are definitely arid.

Hurricanes
Isla Margarita is located in the extreme southern limit of the trajectory of the
hurricanes, which means that it is very rarely affected. However, the hurricane season runs from June to November, and the highest probability is between August and October. In September 2004, Hurricane Ivan, which devastated Grenada, brought moderate winds and storm surges on Isla Margarita and the Venezuelan coast, passing just north of the island. However, Isla Margarita was directly hit by Tropical Storm Alma in August 1974, by the Hurricane 2 of 1933 in July, by Tropical Storm Bret in August 1993, and by another tropical storm called Bret in June 2017.
Best Time
The
best time to go to Isla Margarita runs from late February to late May, since it is the driest, during which it hardly ever rains. Even during the rainy season, fine days actually prevail, however, strong thunderstorms can sometimes break out. If you plan to visit the island from November to mid-February, you will prefer the western part (Macanao Peninsula), or the western part of Paraguachoa.