Select units of measurement for the temperature and rainfall tables (metric or imperial).
Average weather, temperature, rainfall, sunshine hours

The climate of Marmaris is
Mediterranean, with mild, rainy winters and hot, sunny summers. However, the summer is particularly hot.
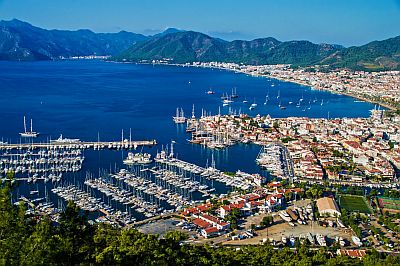
The city is located in southwestern Turkey, on the coast of the Aegean Sea, at almost 37 degrees north latitude. To the south is the Greek island of Rhodes. We are in the so-called Turkish Riviera.

Even though
winter is mild, sometimes there can be cold periods, with lows around freezing or slightly below and highs of 8/9 °C. Very rarely, as in January 2022, it can even snow.
Summer is particularly hot, hotter than the Aegean islands which receive the
meltemi, the north wind that blows in this season. Additionally, there may be heat waves, with highs of 40 °C (104 °F) or more. The record heat is 45 °C (113 °F), set in August 2021, a month in which the average maximum was 38 °C (100.5 °F).
Marmaris - Climate data
In Marmaris, the
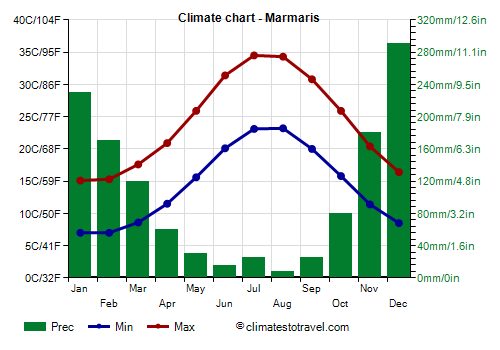
average temperature of the coldest month (January) is of
11 °C, that of the warmest month (July) is of
28.8 °C. Here are the average temperatures.
Marmaris - Average temperatures (1991-2020) |
| Month | Min | Max | Mean |
|---|
| January | 7 | 15.1 | 11 |
|---|
| February | 7 | 15.3 | 11.2 |
|---|
| March | 8.6 | 17.6 | 13.1 |
|---|
| April | 11.5 | 20.9 | 16.2 |
|---|
| May | 15.6 | 25.9 | 20.8 |
|---|
| June | 20.1 | 31.4 | 25.8 |
|---|
| July | 23.1 | 34.5 | 28.8 |
|---|
| August | 23.2 | 34.3 | 28.8 |
|---|
| September | 20 | 30.8 | 25.4 |
|---|
| October | 15.8 | 25.9 | 20.8 |
|---|
| November | 11.4 | 20.4 | 15.9 |
|---|
| December | 8.5 | 16.4 | 12.4 |
|---|
| Year | 14.4 | 24.1 | 19.2 |
|---|
amounts to
1235 millimeters per year: it is therefore quite abundant. It ranges from
7.9 millimeters in the driest month (August) to
290 millimeters in the wettest one (December). Here is the average precipitation.
Marmaris - Average precipitation| Month | Days |
|---|
| January | 230 | 14 |
|---|
| February | 170 | 12 |
|---|
| March | 120 | 9 |
|---|
| April | 60 | 8 |
|---|
| May | 30 | 4 |
|---|
| June | 15 | 3 |
|---|
| July | 25 | 2 |
|---|
| August | 8 | 1 |
|---|
| September | 25 | 2 |
|---|
| October | 80 | 6 |
|---|
| November | 180 | 9 |
|---|
| December | 290 | 14 |
|---|
| Year | 1235 | 83 |
|---|
The
sea temperature ranges from
16.5 °C in February, March to
26.5 °C in August. Here are the average sea temperatures.
Marmaris - Sea temperature| Month |
|---|
| January | 17.5 |
|---|
| February | 16.5 |
|---|
| March | 16.5 |
|---|
| April | 17.5 |
|---|
| May | 20 |
|---|
| June | 23 |
|---|
| July | 25 |
|---|
| August | 26.5 |
|---|
| September | 25.5 |
|---|
| October | 23.5 |
|---|
| November | 20.5"> |
|---|
| December | 18.5 |
|---|
| Year | 20.8 |
|---|
There are on average around 2705
sunshine hours per year. Here are the average hours of sunshine per day.
Marmaris - Sunshine hours| Month | Average | Total |
|---|
| January | 4 | 125 |
|---|
| February | 5 | 140 |
|---|
| March | 6 | 190 |
|---|
| April | 7.5 | 220 |
|---|
| May | 9 | 285 |
|---|
| June | 11 | 325 |
|---|
| July | 11 | 345 |
|---|
| August | 10.5 | 330 |
|---|
| September | 9 | 275 |
|---|
| October | 7 | 215 |
|---|
| November | 5 | 145 |
|---|
| December | 3.5 | 110 |
|---|
| Year | 7.4 | 2705 |
|---|