Select units of measurement for the temperature and rainfall tables (metric or imperial).
Average weather, temperature, rainfall, sunshine
The climate of Trinidad and Tobago is
tropical. Temperatures vary little throughout the year, however, there is a relatively cooler period from December to February and a hot, muggy period from May to October. Luckily, the
trade winds blow all year round, tempering the heat.
As for the
rains, there is a rainy season, which runs from June to December, and a relatively dry season, which runs from February to mid-April.
In the interior of both islands, there are some
elevations: in Trinidad, they are found in the northern part, where there are two peaks reaching 1,000 meters (3,300 feet),
El Cerro del Aripo and
El Tucuche, while Tobago is crossed by a chain of hills and low mountains in the interior, reaching 640 meters (2,100 feet). On the slopes of both islands, the climate is even rainier, especially those facing north, where rainfall reaches as high as 3,800 mm (150 in) per year.
The islands forming the archipelago of Trinidad and Tobago, namely the two main islands of the same name plus some smaller islands (including Little Tobago), are located just north-east of the coast of Venezuela, and are the southernmost of the Lesser Antilles, although some geographers do not consider them as part of the said Lesser Antilles because of their eccentric position, together with Barbados.
The climate in detail
Temperature and rain

In the capital,
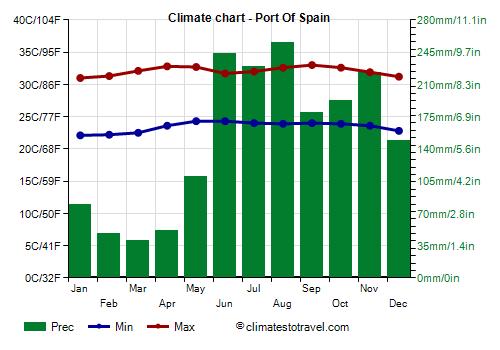
Port of Spain, temperatures are high even in winter, in fact highs from December to February are about 31 °C (88 °F).
Rainfall is abundant: in Port of Spain, on the island of Trinidad, it's around 1,800 millimeters (71 inches) per year, with more than 100 mm (4 in) per month from May to December, and more than 180 mm (7 in) from June to November. In January, the rains are still quite frequent, even though they gradually decrease.
The driest months are February, March and April, with an average of 40/50 mm (1.6/2 in) of rain per month.
In
Scarborough, on the island of Tobago, rainfall is a little less abundant, around 1,500 mm (60 in) per year.
Since the rains occur throughout the year especially in the form of showers or thunderstorms, they do not reduce too much the amount of
sunshine, which is good in all months, especially along the coast.

Sea temperature
The
sea in Trinidad and Tobago is warm enough to swim in throughout the year: the water temperature ranges from 26.5 °C (79.5 °F) from January to March, to 29 °C (84 °F) in September.
Hurricanes
Trinidad and Tobago is in theory just outside of the hurricane belt, and in fact it is
very rarely affected, especially the island of Trinidad, which is even more sheltered because of its southern position. However, we recall that the hurricane season in the Caribbean goes from June to November, though they are more likely from August to October.
Some hurricanes and tropical storms that hit the islands in the past were Hurricane 2 (or Trinidad Hurricane) of July 1933 (the only truly destructive one), Tropical Storm Alma in August 1974, Tropical Storm Bret in August 1993, Hurricane Ivan in September 2004, and Hurricane Felix in September 2007.
When to go
The best time to visit Trinidad and Tobago is from
February to April, which is by far the driest period of the year.
Since these islands are almost always outside of the hurricanes paths, in theory you can also choose the
summer, keeping in mind that it is very rainy and also a bit muggy.
December is still a rainy month, but it's outside of the hurricane season, and also a little cooler.
What to pack
All year round: pack
light clothes of natural fabric, and possibly a light sweatshirt and a light raincoat for thunderstorms, especially from June to December. From December to March, you can add a light sweatshirt for the evening.
When going to the reef, you can bring snorkeling equipment, including water shoes or rubber-soled shoes.
Climate data - Trinidad And Tobago
| Port Of Spain |
|---|
|
| Jan | Feb | Mar | Apr | May | Jun | Jul | Aug | Sep | Oct | Nov | Dec |
|---|
| Min temp. | 22 | 22 | 22 | 24 | 24 | 24 | 24 | 24 | 24 | 24 | 24 | 23 |
|---|
| Max temp. | 31 | 31 | 32 | 33 | 33 | 32 | 32 | 33 | 33 | 33 | 32 | 31 |
|---|
| Precip. | 80 | 50 | 40 | 50 | 110 | 245 | 230 | 255 | 180 | 195 | 225 | 150 |
|---|
| Prec. days | 11 | 8 | 6 | 6 | 11 | 19 | 19 | 18 | 14 | 15 | 17 | 15 |
|---|
| Humidity | 79% | 76% | 74% | 74% | 77% | 82% | 82% | 82% | 81% | 82% | 84% | 82% |
|---|
| Day length | 12 | 12 | 12 | 12 | 13 | 13 | 13 | 12 | 12 | 12 | 12 | 12 |
|---|
| Sun hours | 8 | 9 | 8 | 9 | 8 | 7 | 7 | 7 | 7 | 7 | 7 | 7 |
|---|
| Sea temp | 27 | 26 | 27 | 27 | 27 | 28 | 28 | 29 | 29 | 29 | 28 | 27 |
|---|
| Scarborough |
|---|
|
| Jan | Feb | Mar | Apr | May | Jun | Jul | Aug | Sep | Oct | Nov | Dec |
|---|
| Min temp. | 23 | 23 | 23 | 24 | 25 | 24 | 24 | 24 | 25 | 24 | 24 | 23 |
|---|
| Max temp. | 30 | 30 | 31 | 31 | 32 | 31 | 31 | 32 | 32 | 32 | 31 | 30 |
|---|
| Precip. | 45 | 50 | 45 | 45 | 65 | 150 | 190 | 165 | 170 | 220 | 205 | 160 |
|---|
| Prec. days | 10 | 6 | 5 | 6 | 9 | 16 | 17 | 15 | 14 | 16 | 16 | 12 |
|---|
| Humidity | 76% | 74% | 73% | 73% | 75% | 77% | 78% | 78% | 77% | 79% | 80% | 78% |
|---|
| Day length | 12 | 12 | 12 | 12 | 13 | 13 | 13 | 12 | 12 | 12 | 12 | 12 |
|---|
|
| Sea temp | 27 | 27 | 27 | 27 | 28 | 28 | 28 | 29 | 29 | 29 | 28 | 28 |
|---|