Select units of measurement for the temperature and rainfall tables (metric or imperial).
Average weather, temperature, rainfall, sunshine hours
In Ko Chang, and on the nearby islands of Ko Mak and Ko Kut, the climate is
tropical, hot all year round, with a rainy season due to the southwest monsoon, which runs from May to October (and is felt in a remarkable way in this area), and a dry season from December to April. In March and April, before the monsoon, there is a certain rise in showers, while in November, a tropical cyclone can still affect this area (see below).
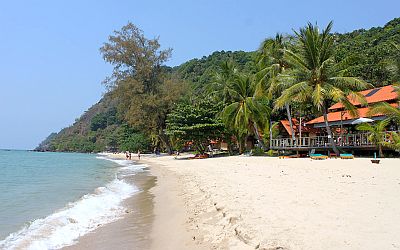
Koh Chang, whose name means "Elephant Island", is located in the Gulf of Siam; it is the second largest island of Thailand and is protected, together with the surrounding islands and the coral reef, in the
Mu Ko Chang National Park. In the interior of the island, there are some hills, which reach 744 meters (2,440 feet), and are covered by a rainforest. The rivers that originate from these hills give rise to several waterfalls, including those of Klong Plu.
The
temperature is high throughout the year, in fact, average highs never drop below 30 °C (86 °F). However, from December to March, the humidity is slightly lower. During the night, temperatures rarely drop below 20 °C (68 °F), although this can sometimes happen between December and March. From February to April, ie before the arrival of the monsoon, there is a slight increase in temperature, and March and April (together with May, ie the first monsoon month) are usually the hottest months of the year, with temperatures quite often reaching 35/36 °C (95/97 °F).
Here are the average temperatures of the city of Chanthaburi, which is located on the mainland, near the coast.
Chanthaburi - Average temperatures (1991-2020) |
| Month | Min | Max | Mean |
|---|
| January | 22 | 32.6 | 27.3 |
|---|
| February | 23 | 32.8 | 27.9 |
|---|
| March | 24.3 | 33.3 | 28.8 |
|---|
| April | 24.9 | 34.1 | 29.5 |
|---|
| May | 25.2 | 33.3 | 29.2 |
|---|
| June | 25 | 32.1 | 28.6 |
|---|
| July | 24.9 | 31.6 | 28.3 |
|---|
| August | 24.8 | 31.5 | 28.2 |
|---|
| September | 24.5 | 31.5 | 28 |
|---|
| October | 24 | 32.3 | 28.2 |
|---|
| November | 23.3 | 32.6 | 27.9 |
|---|
| December | 22 | 32 | 27 |
|---|
| Year | 24 | 32.5 | 28.2 |
|---|
An average of approximately 3,000 millimeters (120 inches) of
rain falls each year. As mentioned, we are in an area where the rains in the monsoon period are particularly abundant, since the south-western winds hit it directly. From June to September, precipitation reaches as high as 500 mm (20 in) per month.
This is the average rainfall in Chanthaburi.
Chanthaburi - Average precipitation| Month | Days |
|---|
| January | 20 | 2 |
|---|
| February | 35 | 4 |
|---|
| March | 70 | 7 |
|---|
| April | 125 | 11 |
|---|
| May | 395 | 22 |
|---|
| June | 515 | 24 |
|---|
| July | 485 | 24 |
|---|
| August | 495 | 25 |
|---|
| September | 500 | 25 |
|---|
| October | 300 | 18 |
|---|
| November | 55 | 6 |
|---|
| December | 7 | 1 |
|---|
| Year | 2995 | 169 |
|---|
The amount of
sunshine in Koh Chang is quite good in the dry season, from November to April, while during the rainy season, the sun is rarely seen. Here are the average sunshine hours per day.
Chanthaburi - Sunshine hours| Month | Average | Total |
|---|
| January | 7.5 | 230 |
|---|
| February | 6.5 | 180 |
|---|
| March | 6.5 | 200 |
|---|
| April | 7 | 205 |
|---|
| May | 4 | 120 |
|---|
| June | 2 | 55 |
|---|
| July | 2 | 60 |
|---|
| August | 2 | 60 |
|---|
| September | 2 | 55 |
|---|
| October | 4.5 | 145 |
|---|
| November | 6.5 | 190 |
|---|
| December | 7.5 | 225 |
|---|
| Year | 4.7 | 1725 |
|---|
Koh Chang can be affected by
tropical cyclones, in particular by typhoons, which come from the east, normally from June to December (although they are more frequent from September to November), and generally affect more directly the interior of Thailand, but they can sometimes also enter the Gulf of Thailand.

The
sea in Ko Chang is warm enough to swim in all year round, as you can see in the following table.
Ko Chang - Sea temperature| Month |
|---|
| January | 28 |
|---|
| February | 28.5 |
|---|
| March | 29 |
|---|
| April | 30 |
|---|
| May | 30.5 |
|---|
| June | 30 |
|---|
| July | 29.5 |
|---|
| August | 29.5 |
|---|
| September | 29 |
|---|
| October | 29 |
|---|
| November | 29"> |
|---|
| December | 28.5 |
|---|
| Year | 29.3 |
|---|
Best Time
The
best time to go to Koh Chang for a beach holiday is the dry season, from December to March or April. In November, usually, the rains are already rare, but as I said, a tropical cyclone can still affect the island, while in March and April it is hot, and the pre-monsoon rains become more frequent, so the best time of all is from December to February.