Select units of measurement for the temperature and rainfall tables (metric or imperial).
Average weather, temperature, rainfall, sunshine hours

In Zermatt, there is a
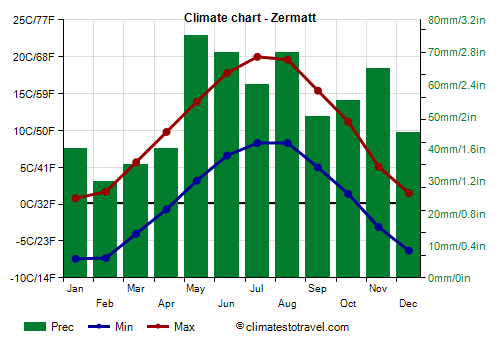
cold mountain climate, with very cold winters, during which the temperature is often below freezing, and cool to mild summers.
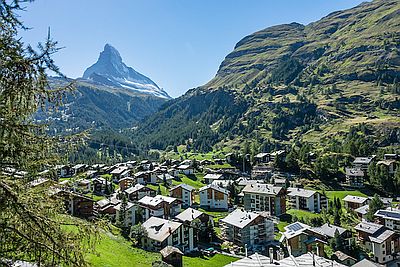
The village is located at 1,600 meters (5,200 feet) in the Valais, at the foot of the Matterhorn. We are in an area surrounded by high mountains, where precipitation is quite scarce.
In
winter, in periods of high pressure, the sun shines and the temperature exceeds freezing during the day. In periods of bad weather, however, it snows and the temperature remains below freezing even during the day.
During cold spells, the temperature drops to very low values, though not much lower than in the cities of the Swiss plateau. The temperature dropped to -19.5 °C (-3 °F) in February 1991 and to -22 °C (-7.5 °F) in February 2012.
In
summer, temperatures are mild during the day, and very cool, or even cold, at night. Even though the mountain sun increases the feeling of heat, the temperature never reaches very high values. Generally, it reaches 26/27 °C (79/81 °F) on the warmest days of the year. However, after the year 2000, hot days have become more frequent due to global warming. The temperature reached 30 °C (86 °F) in late June 2019 and in August 2003.

Best Time
The best time to visit Zermatt is the summer, and in particular, the months of July and August, because they are the mildest, although there are often afternoon thunderstorms. Also, since it can get cold at night, it's better to bring a jacket and a sweater even in this period.
Late winter and early spring (February-March) are recommended for a ski holiday, since the days are longer than in December and January.
Zermatt - Climate data
In Zermatt, the
average temperature of the coldest month (January) is of
-3.3 °C, that of the warmest month (July) is of
14.2 °C. Here are the average temperatures.
Zermatt - Average temperatures (1991-2020) |
| Month | Min | Max | Mean |
|---|
| January | -7.4 | 0.8 | -3.3 |
|---|
| February | -7.3 | 1.7 | -2.8 |
|---|
| March | -4 | 5.7 | 0.8 |
|---|
| April | -0.7 | 9.8 | 4.6 |
|---|
| May | 3.2 | 13.9 | 8.6 |
|---|
| June | 6.6 | 17.8 | 12.2 |
|---|
| July | 8.3 | 20 | 14.2 |
|---|
| August | 8.3 | 19.6 | 14 |
|---|
| September | 5 | 15.4 | 10.2 |
|---|
| October | 1.4 | 11.2 | 6.3 |
|---|
| November | -3.1 | 5.1 | 1 |
|---|
| December | -6.3 | 1.5 | -2.4 |
|---|
| Year | 0.4 | 10.3 | 5.3 |
|---|
amounts to
640 millimeters per year: so, it is at an intermediate level. It ranges from
30 millimeters in the driest month (February) to
75 millimeters in the wettest one (May). Here is the average precipitation.
Zermatt - Average precipitation| Month | Days |
|---|
| January | 40 | 6 |
|---|
| February | 30 | 6 |
|---|
| March | 35 | 5 |
|---|
| April | 40 | 6 |
|---|
| May | 75 | 10 |
|---|
| June | 70 | 10 |
|---|
| July | 60 | 9 |
|---|
| August | 70 | 10 |
|---|
| September | 50 | 7 |
|---|
| October | 55 | 7 |
|---|
| November | 65 | 7 |
|---|
| December | 45 | 7 |
|---|
| Year | 640 | 90 |
|---|
There are on average around 1650
sunshine hours per year. Here are the average hours of sunshine per day.
Zermatt - Sunshine hours| Month | Average | Total |
|---|
| January | 3 | 95 |
|---|
| February | 4 | 110 |
|---|
| March | 5 | 150 |
|---|
| April | 5 | 145 |
|---|
| May | 5 | 155 |
|---|
| June | 5.5 | 170 |
|---|
| July | 6 | 185 |
|---|
| August | 5.5 | 175 |
|---|
| September | 5 | 155 |
|---|
| October | 4.5 | 135 |
|---|
| November | 3 | 90 |
|---|
| December | 2.5 | 85 |
|---|
| Year | 4.5 | 1650 |
|---|