Select units of measurement for the temperature and rainfall tables (metric or imperial).
Average weather, temperature, rainfall, sunshine hours

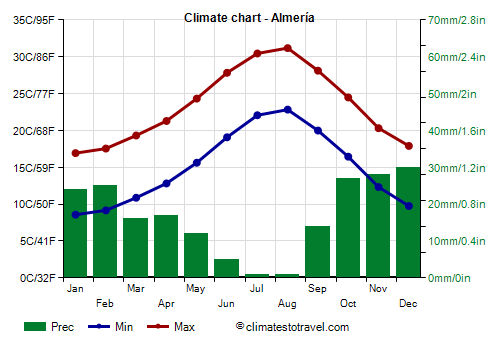
In Almería, a city located on the southern coast of Spain, in the south-east of Andalusia, the climate can be considered as
Mediterranean, in fact, is has mild, relatively rainy winters and hot, sunny summers. However, the aridity is remarkable, so much so that the landscape is
desert.
Winter, from December to February, is a mild season, and it's characterized by sunny periods alternating with periods of bad weather, with wind and rain, which, however, are quite rare.
There is a good number of sunny days, with daytime temperatures reaching 18/20 °C (64/68 °F) even in winter. With the wind from Africa, it can instead exceed 20 °C (68 °F).
Due to the sheltered position, in the extreme south of Spain and with the mountains to the north, very cold days are rare. On the coldest nights of the year, the temperature typically drops to 4/5 °C (39/41 °F).
The coldest record in Almería is 0 °C (32 °F), recorded in January 2005. In practice, it never snows.
In
summer, the heat is generally bearable, and sea breezes blow, but there may be periods of intense heat. On the hottest days of the year, the temperature typically reaches 38/40 °C (100/104 °F). The heat record is 41.6 °C (107 °F), set in July 2019.

Almeria - Climate data
In Almeria, the
average temperature of the coldest month (January) is of
12.8 °C, that of the warmest month (August) is of
27 °C. Here are the average temperatures.
Almeria - Average temperatures (1991-2020) |
| Month | Min | Max | Mean |
|---|
| January | 8.6 | 16.9 | 12.8 |
|---|
| February | 9.2 | 17.6 | 13.4 |
|---|
| March | 10.9 | 19.3 | 15.1 |
|---|
| April | 12.8 | 21.3 | 17.1 |
|---|
| May | 15.6 | 24.3 | 20 |
|---|
| June | 19.1 | 27.8 | 23.5 |
|---|
| July | 22.1 | 30.4 | 26.3 |
|---|
| August | 22.8 | 31.2 | 27 |
|---|
| September | 20 | 28.1 | 24.1 |
|---|
| October | 16.4 | 24.5 | 20.5 |
|---|
| November | 12.3 | 20.3 | 16.3 |
|---|
| December | 9.8 | 17.9 | 13.8 |
|---|
| Year | 15 | 23.3 | 19.15 |
|---|
amounts to
200 millimeters per year: it is therefore at a desert level. It ranges from
1 millimeters in the driest months (July, August) to
30 millimeters in the wettest one (December). Here is the average precipitation.
Almeria - Average precipitation| Month | Days |
|---|
| January | 24 | 3 |
|---|
| February | 25 | 3 |
|---|
| March | 16 | 3 |
|---|
| April | 17 | 3 |
|---|
| May | 12 | 2 |
|---|
| June | 5 | 0 |
|---|
| July | 1 | 0 |
|---|
| August | 1 | 0 |
|---|
| September | 14 | 2 |
|---|
| October | 27 | 3 |
|---|
| November | 28 | 4 |
|---|
| December | 30 | 3 |
|---|
| Year | 200 | 25 |
|---|
The
sea temperature ranges from
15 °C in January, February, March to
24 °C in August. Here are the average sea temperatures.
Almeria - Sea temperature| Month |
|---|
| January | 15 |
|---|
| February | 15 |
|---|
| March | 15 |
|---|
| April | 16 |
|---|
| May | 17 |
|---|
| June | 20 |
|---|
| July | 22 |
|---|
| August | 24 |
|---|
| September | 23 |
|---|
| October | 20 |
|---|
| November | 18"> |
|---|
| December | 16 |
|---|
| Year | 18.4 |
|---|
There are on average around 2990
sunshine hours per year. Here are the average hours of sunshine per day.
Almeria - Sunshine hours| Month | Average | Total |
|---|
| January | 6.5 | 195 |
|---|
| February | 7 | 190 |
|---|
| March | 7.5 | 230 |
|---|
| April | 8.5 | 260 |
|---|
| May | 9.5 | 295 |
|---|
| June | 11 | 325 |
|---|
| July | 11 | 340 |
|---|
| August | 10 | 315 |
|---|
| September | 8.5 | 255 |
|---|
| October | 7 | 220 |
|---|
| November | 6 | 185 |
|---|
| December | 5.5 | 180 |
|---|
| Year | 8.2 | 2990 |
|---|