Select units of measurement for the temperature and rainfall tables (metric or imperial).
Average weather, temperature, rainfall, sunshine hours
The climate of Cagayan de Oro is
tropical, hot all year round, although with slightly lower temperatures from December to February and higher from April to September.
As for the rainfall, there is a relatively dry season from February to April, while it exceeds 95 mm (3.7 in) per month from May to January. Rainfall is due in the first part (May-September) to the southwest monsoon, and in the second part (October-January) to the northeast monsoon. However, the rainiest period, with heavy rainfall, is from June to October.
On the hottest days, the
temperature can reach 35/36 °C (95/97 °F) practically all year round, although this rarely happens in "winter", from December to February.
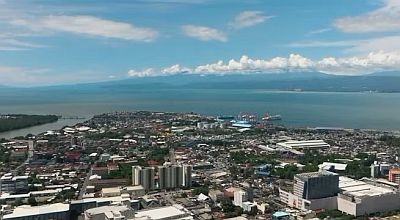
Cagayan de Oro is a city of 730,000 inhabitants, located in the southern Philippines, on the northern coast of the island of
Mindanao, on Macajalar Bay, and at 8 degrees north latitude.

Cagayan de Oro can occasionally be hit by
typhoons, the tropical cyclones of Southeast Asia, although the southern Philippines is hit less often than the central and northern part of the country. Typhoons generally occur from May to December, although they are more frequent between August and November.
Cagayan De Oro - Climate data
In Cagayan De Oro, the
average temperature of the coldest month (January) is of
25.8 °C, that of the warmest month (May) is of
28.2 °C. Here are the average temperatures.
Cagayan De Oro - Average temperatures (1991-2020) |
| Month | Min | Max | Mean |
|---|
| January | 21.7 | 29.8 | 25.8 |
|---|
| February | 21.6 | 30.3 | 26 |
|---|
| March | 21.9 | 31.4 | 26.6 |
|---|
| April | 22.7 | 32.6 | 27.6 |
|---|
| May | 23.3 | 33 | 28.2 |
|---|
| June | 22.9 | 32.1 | 27.5 |
|---|
| July | 22.6 | 31.7 | 27.2 |
|---|
| August | 22.6 | 32.2 | 27.4 |
|---|
| September | 22.5 | 32.1 | 27.3 |
|---|
| October | 22.4 | 31.5 | 27 |
|---|
| November | 22.2 | 31.1 | 26.6 |
|---|
| December | 22.1 | 30.4 | 26.2 |
|---|
| Year | 22.4 | 31.5 | 26.9 |
|---|
amounts to
1775 millimeters per year: it is therefore abundant. It ranges from
57.6 millimeters in the driest month (March) to
247.3 millimeters in the wettest one (July). Here is the average precipitation.
Cagayan De Oro - Average precipitation| Month | Days |
|---|
| January | 98 | 10 |
|---|
| February | 85 | 8 |
|---|
| March | 58 | 6 |
|---|
| April | 62 | 6 |
|---|
| May | 129 | 11 |
|---|
| June | 220 | 16 |
|---|
| July | 247 | 17 |
|---|
| August | 197 | 14 |
|---|
| September | 221 | 15 |
|---|
| October | 192 | 14 |
|---|
| November | 127 | 10 |
|---|
| December | 138 | 9 |
|---|
| Year | 1775 | 136 |
|---|
The
sea temperature ranges from
27.5 °C in January, February to
29.5 °C in May, June, July, August, September, October. Here are the average sea temperatures.
Cagayan De Oro - Sea temperature| Month |
|---|
| January | 27.5 |
|---|
| February | 27.5 |
|---|
| March | 28 |
|---|
| April | 28.5 |
|---|
| May | 29.5 |
|---|
| June | 29.5 |
|---|
| July | 29.5 |
|---|
| August | 29.5 |
|---|
| September | 29.5 |
|---|
| October | 29.5 |
|---|
| November | 29"> |
|---|
| December | 28.5 |
|---|
| Year | 28.9 |
|---|