Select units of measurement for the temperature and rainfall tables (metric or imperial).
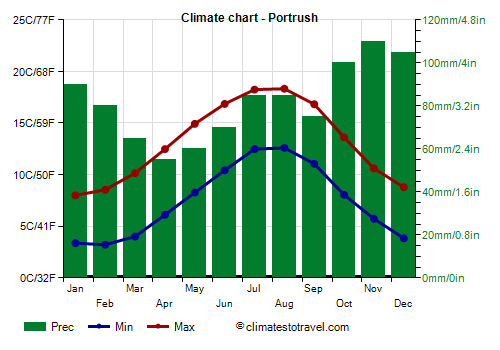
Average weather, temperature, rainfall, sunshine hours

The climate of Portrush is
oceanic, with quite cold, rainy winters and mild, relatively rainy summers.
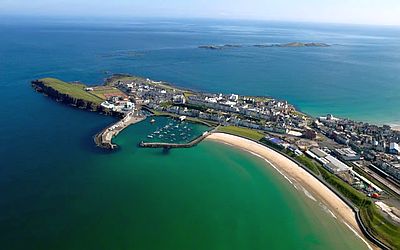
The city is located on the northern coast of Northern Ireland.
Winter, from December to February, is quite cold: temperatures are not so low, but wind and humidity can increase the sensation of cold. The sky is often cloudy, and rainfall is frequent. Sometimes, intense Atlantic depressions can cause wind storms.
Snowfalls are rare and not abundant. Usually, cold spells are not intense and do not last long. The temperature rarely drops below -5 °C (23 °F).
In
spring, from March to May, the temperature slowly rises, and Atlantic fronts become a bit less frequent. In May, it is often still quite cold, especially in the first half of the month.
Summer, from June to August, is cool, with quite frequent rains.
Hot days are rare: the temperature may not reach 25 °C (77 °F) for an entire month.
Autumn, from September to November, is gray, cloudy and rainy, and with each passing week, it gets progressively colder. In November, the wind is often moderate or strong.

Best Time
The best time to visit Portrush is the summer,
from June to August, since it is the mildest of the year. The temperatures are generally good for outdoors activities, although it's better to bring an umbrella, and a sweatshirt or sweater for the evening or for cool days.
Portrush - Climate data
In Portrush, the
average temperature of the coldest month (January) is of
5.7 °C, that of the warmest month (August) is of
15.5 °C. Here are the average temperatures.
Portrush - Average temperatures (1991-2020) |
| Month | Min | Max | Mean |
|---|
| January | 3.4 | 8 | 5.7 |
|---|
| February | 3.2 | 8.5 | 5.9 |
|---|
| March | 4 | 10.2 | 7.1 |
|---|
| April | 6.1 | 12.5 | 9.3 |
|---|
| May | 8.3 | 14.9 | 11.6 |
|---|
| June | 10.4 | 16.9 | 13.6 |
|---|
| July | 12.5 | 18.2 | 15.4 |
|---|
| August | 12.6 | 18.3 | 15.5 |
|---|
| September | 11.1 | 16.8 | 13.9 |
|---|
| October | 8 | 13.6 | 10.8 |
|---|
| November | 5.7 | 10.6 | 8.2 |
|---|
| December | 3.8 | 8.8 | 6.3 |
|---|
| Year | 7.5 | 13.1 | 10.3 |
|---|
amounts to
975 millimeters per year: so, it is at an intermediate level. It ranges from
55 millimeters in the driest month (April) to
110 millimeters in the wettest one (November). Here is the average precipitation.
Portrush - Average precipitation| Month | Days |
|---|
| January | 90 | 18 |
|---|
| February | 80 | 14 |
|---|
| March | 65 | 14 |
|---|
| April | 55 | 12 |
|---|
| May | 60 | 13 |
|---|
| June | 70 | 13 |
|---|
| July | 85 | 15 |
|---|
| August | 85 | 15 |
|---|
| September | 75 | 14 |
|---|
| October | 100 | 16 |
|---|
| November | 110 | 18 |
|---|
| December | 105 | 18 |
|---|
| Year | 975 | 181 |
|---|
The
sea temperature ranges from
8 °C in February, March to
14.5 °C in August. Here are the average sea temperatures.
Portrush - Sea temperature| Month |
|---|
| January | 8.5 |
|---|
| February | 8 |
|---|
| March | 8 |
|---|
| April | 8.5 |
|---|
| May | 10 |
|---|
| June | 12 |
|---|
| July | 13.5 |
|---|
| August | 14.5 |
|---|
| September | 14 |
|---|
| October | 13 |
|---|
| November | 11.5"> |
|---|
| December | 10 |
|---|
| Year | 11 |
|---|
There are on average around 1440
sunshine hours per year. Here are the average hours of sunshine per day.
Portrush - Sunshine hours| Month | Average | Total |
|---|
| January | 1.5 | 55 |
|---|
| February | 2.5 | 75 |
|---|
| March | 3.5 | 115 |
|---|
| April | 6.5 | 190 |
|---|
| May | 7 | 225 |
|---|
| June | 5.5 | 165 |
|---|
| July | 5 | 160 |
|---|
| August | 4.5 | 145 |
|---|
| September | 4 | 125 |
|---|
| October | 3 | 100 |
|---|
| November | 2 | 55 |
|---|
| December | 1 | 40 |
|---|
| Year | 4 | 1440 |
|---|