Select units of measurement for the temperature and rainfall tables (metric or imperial).
Average weather, temperature, rainfall, sunshine hours

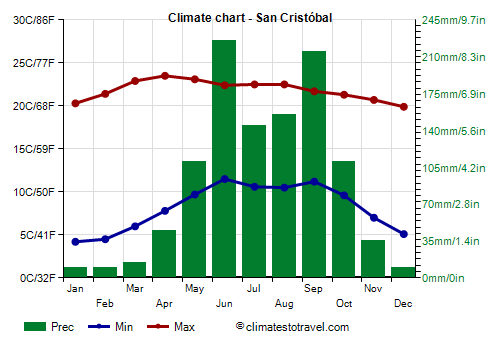
The climate of San Cristóbal de las Casas is
subtropical, with a dry season from November to April and a rainy season from May to October.
The city is located in Chiapas, in southeastern Mexico, at 16 degrees north latitude, and at 2,200 meters (7,200 feet) above sea level, therefore in the
tierras frìas.
In
winter, the temperature range is strong, and nights are cold. During the coldest days of the year, the temperature can drop to around freezing, but even in these cases, during the day they generally exceed 20 °C (68 °F).
On the hottest days of the year, in April or May, the temperature can reach 28/30 °C (82/86 °F).
From June to November (but more likely from August to October), there is a risk of
hurricanes. However, we are in a relatively protected area, halfway between the area affected by the hurricanes from the Gulf of Mexico and those of the Pacific.
The
average temperature of the coldest month (January) is of 12.2 °C (54 °F), that of the warmest month (June) is of 17 °C (62.5 °F). Here are the average temperatures.
San Cristóbal - Average temperatures (1951-2010) |
| Month | Min | Max | Mean |
|---|
| January | 4.2 | 20.3 | 12.2 |
|---|
| February | 4.5 | 21.4 | 13 |
|---|
| March | 6 | 22.9 | 14.4 |
|---|
| April | 7.8 | 23.5 | 15.6 |
|---|
| May | 9.7 | 23.1 | 16.4 |
|---|
| June | 11.5 | 22.4 | 17 |
|---|
| July | 10.6 | 22.5 | 16.6 |
|---|
| August | 10.5 | 22.5 | 16.5 |
|---|
| September | 11.2 | 21.7 | 16.4 |
|---|
| October | 9.6 | 21.3 | 15.4 |
|---|
| November | 7 | 20.7 | 13.8 |
|---|
| December | 5.1 | 19.9 | 12.5 |
|---|
| Year | 8.2 | 21.9 | 14.95 |
|---|
amounts to 1,085 millimeters (42.7 inches) per year: so, it is at an intermediate level. It ranges from 10 mm (0.4 in) in the driest months (January, February, December) to 225 mm (8.9 in) in the wettest (June). Here is the average precipitation.
San Cristóbal - Average precipitation| Month | Days |
|---|
| January | 10 | 3 |
|---|
| February | 10 | 2 |
|---|
| March | 15 | 2 |
|---|
| April | 45 | 6 |
|---|
| May | 110 | 11 |
|---|
| June | 225 | 19 |
|---|
| July | 145 | 14 |
|---|
| August | 155 | 16 |
|---|
| September | 215 | 20 |
|---|
| October | 110 | 11 |
|---|
| November | 35 | 5 |
|---|
| December | 10 | 2 |
|---|
| Year | 1085 | 112 |
|---|
On average, there are around 2,090
sunshine hours per year. Here are the average sunshine hours per day.
San Cristóbal - Sunshine hours| Month | Average | Total |
|---|
| January | 7 | 215 |
|---|
| February | 7 | 200 |
|---|
| March | 6.5 | 205 |
|---|
| April | 6 | 180 |
|---|
| May | 5.5 | 170 |
|---|
| June | 4.5 | 140 |
|---|
| July | 5.5 | 175 |
|---|
| August | 6 | 180 |
|---|
| September | 4 | 115 |
|---|
| October | 5 | 150 |
|---|
| November | 6 | 175 |
|---|
| December | 6 | 190 |
|---|
| Year | 5.7 | 2090 |
|---|

Best Time
The best time to visit San Cristóbal de las Casas is from November to April, since it is the dry season; at night, however, it can get cold.