Select units of measurement for the temperature and rainfall tables (metric or imperial).
Average weather, temperature, rainfall, sunshine hours

In Ciudad Juárez, there is a
desert climate, mild in winter, but with cold nights, and definitely hot in summer.
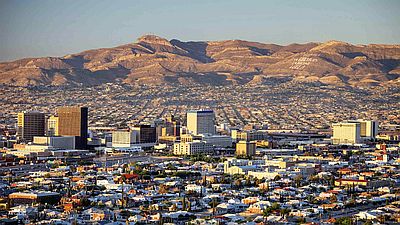
The city is located in the far north of Mexico, in the state of Chihuahua, at 1,150 meters (3,800 feet) above sea level, and is crossed by the Rio Grande River. Beyond the border with the United States is the twin city of El Paso. We are in the Chihuahuan desert, where some rain can occur from July to September, and sometimes, a particularly intense thunderstorm.
In
winter, from late November to February, there can be cold days, with highs below 10 °C (50 °F). Typically, the temperature drops a few degrees below freezing on the coldest nights of winter (-2/-4 °C or 25/28 °F), and sometimes it can even snow. But once every several years, there can be a real wave of polar cold, which lasts a few days. One of the worst was the cold wave of February 2011, when the temperature dropped to -17 °C (1.5 °F).
The wind can raise desert dust, especially in the spring.
In
summer, June is generally the hottest month, but in July and August the humidity increases slightly, making the heat a little more muggy. On warmer days, generally in June and sometimes in July, the temperature reaches 40/42 °C (104/108 °F).

Best Time
The best seasons to visit Ciudad Juárez are spring and autumn, to avoid both the winter cold and summer heat, even if they are unstable periods. For example, the months of April and October can be chosen. In winter, it is usually sunny and not too cold, but sometimes there can be cold waves.
Ciudad Juárez - Climate data
In Ciudad Juárez, the
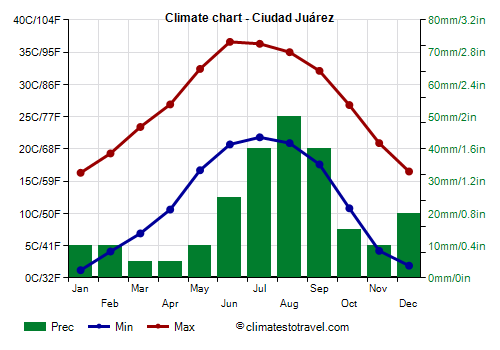
average temperature of the coldest month (January) is of
8.8 °C, that of the warmest month (July) is of
29 °C. Here are the average temperatures.
Ciudad Juárez - Average temperatures (1981-2010) |
| Month | Min | Max | Mean |
|---|
| January | 1.2 | 16.3 | 8.8 |
|---|
| February | 4.1 | 19.3 | 11.7 |
|---|
| March | 6.9 | 23.4 | 15.2 |
|---|
| April | 10.6 | 26.9 | 18.8 |
|---|
| May | 16.7 | 32.4 | 24.5 |
|---|
| June | 20.7 | 36.6 | 28.6 |
|---|
| July | 21.8 | 36.3 | 29 |
|---|
| August | 20.9 | 35 | 28 |
|---|
| September | 17.6 | 32.1 | 24.8 |
|---|
| October | 10.8 | 26.8 | 18.8 |
|---|
| November | 4.2 | 20.9 | 12.5 |
|---|
| December | 1.9 | 16.5 | 9.2 |
|---|
| Year | 11.5 | 26.9 | 19.15 |
|---|
amounts to
245 millimeters per year: it is therefore scarce. It ranges from
5 millimeters in the driest months (March, April) to
50 millimeters in the wettest one (August). Here is the average precipitation.
Ciudad Juárez - Average precipitation| Month | Days |
|---|
| January | 10 | 4 |
|---|
| February | 10 | 3 |
|---|
| March | 5 | 2 |
|---|
| April | 5 | 2 |
|---|
| May | 10 | 3 |
|---|
| June | 25 | 4 |
|---|
| July | 40 | 8 |
|---|
| August | 50 | 9 |
|---|
| September | 40 | 6 |
|---|
| October | 15 | 5 |
|---|
| November | 10 | 3 |
|---|
| December | 20 | 4 |
|---|
| Year | 245 | 53 |
|---|
There are on average around 3760
sunshine hours per year. Here are the average hours of sunshine per day.
Ciudad Juárez - Sunshine hours| Month | Average | Total |
|---|
| January | 8 | 255 |
|---|
| February | 9.5 | 265 |
|---|
| March | 10.5 | 325 |
|---|
| April | 11.5 | 350 |
|---|
| May | 12.5 | 385 |
|---|
| June | 13 | 385 |
|---|
| July | 11.5 | 360 |
|---|
| August | 11 | 335 |
|---|
| September | 10 | 305 |
|---|
| October | 9.5 | 300 |
|---|
| November | 8.5 | 260 |
|---|
| December | 8 | 245 |
|---|
| Year | 10.3 | 3760 |
|---|