Select units of measurement for the temperature and rainfall tables (metric or imperial).
Average weather, temperature, rainfall, sunshine hours

The climate of Pavlodar is
semi-arid continental, with very cold winters and warm summers.
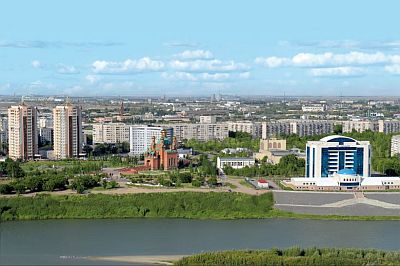
Pavlodar is a city of 365,000 inhabitants located in the north-east of Kazakhstan, in the region (oblys) of the same name, of which it is the capital, on the banks of the Irtysh River, and at 52 degrees north latitude.
About 115 km (70 mi) to the northeast is the border with Russia.
 Precipitation
 is quite scarce, amounting to about 310 millimeters (12 inches) per year. Summer is the rainiest season. In the Köppen classification, the climate of Pavlodar is considered humid continental with warm summer (Dfb), because there are several cold months, in which evaporation is low.
Winter, from November to March, is very cold: the average temperature in January is around -16.5 °C (2.5 °F). Due to its location in the northeast, Pavlodar is actually one of the coldest cities in Kazakhstan, surpassed only by the hilly and mountainous regions of the east.
Due to the arid climate, snowfall is usually light. However, there are periods when light snow often falls.
During
cold spells, the temperature drops every year to around or below -30 °C (-22 °F), and can occasionally drop below -40 °C (-40 °F). The coldest record is -47 °C (-52.6 °F), set in January 1907. In January 1969, the daily average was -31.7 °C (-25.1 °F).
Summer, from June to August, is warm and sunny, although with fairly frequent rains and thunderstorms. The average in July is around 21 °C (70 °F).
Sometimes there can be
heat waves, during which the temperature can exceed 35 °C (95 °F). The hottest record is 42.3 °C (108.1 °F), set in July 1973.
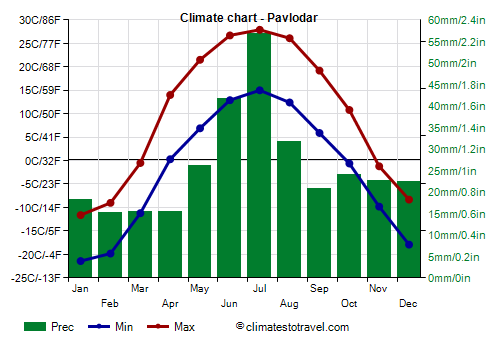
Pavlodar - Climate data
In Pavlodar, the
average temperature of the coldest month (January) is of
-16.5 °C, that of the warmest month (July) is of
21.4 °C. Here are the average temperatures.
Pavlodar - Average temperatures (1991-2020) |
| Month | Min | Max | Mean |
|---|
| January | -21.4 | -11.6 | -16.5 |
|---|
| February | -19.8 | -9 | -14.4 |
|---|
| March | -11.2 | -0.5 | -5.8 |
|---|
| April | 0.3 | 14 | 7.2 |
|---|
| May | 6.9 | 21.5 | 14.2 |
|---|
| June | 12.9 | 26.7 | 19.8 |
|---|
| July | 15 | 27.9 | 21.4 |
|---|
| August | 12.4 | 26.1 | 19.2 |
|---|
| September | 5.9 | 19.2 | 12.6 |
|---|
| October | -0.6 | 10.8 | 5.1 |
|---|
| November | -9.8 | -1.2 | -5.5 |
|---|
| December | -17.9 | -8.3 | -13.1 |
|---|
| Year | -2.2 | 9.7 | 3.75 |
|---|
amounts to
310 millimeters per year: it is therefore scarce. It ranges from
15.1 millimeters in the driest month (February) to
56.8 millimeters in the wettest one (July). Here is the average precipitation.
Pavlodar - Average precipitation| Month | Days |
|---|
| January | 18 | 6 |
|---|
| February | 15 | 5 |
|---|
| March | 16 | 4 |
|---|
| April | 15 | 4 |
|---|
| May | 26 | 5 |
|---|
| June | 42 | 7 |
|---|
| July | 57 | 8 |
|---|
| August | 32 | 6 |
|---|
| September | 21 | 5 |
|---|
| October | 24 | 6 |
|---|
| November | 23 | 6 |
|---|
| December | 22 | 7 |
|---|
| Year | 310 | 70 |
|---|