Select units of measurement for the temperature and rainfall tables (metric or imperial).
Average weather, temperature, rainfall, sunshine hours

The climate of Vicenza is
moderately continental, with cold, damp winters and hot, muggy summers. The climate is similar to that of the Po valley, with respect to which it is a bit milder in winter, but also a little more windy, in fact it is exposed to both the bora (a cold, dry wind from the north-east) and the sirocco (mild south-east wind).
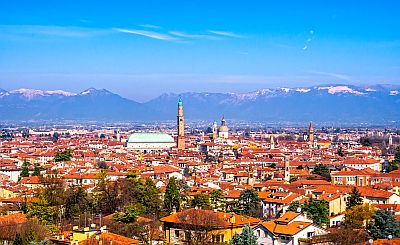
The city is located in northern Italy, in the Venetian plain, at 45 degrees north latitude, and is crossed by the Bacchiglione river. Venice is located about 50 km (30 mi) east-southeast.
To the south are the Berici hills, which reach 444 meters (1,456 feet) in height. To the west are the first hills of the small Dolomites, whose highest peak, Carega, reaches 2,259 metres (7,411 ft).
 Winter
, from December to February, is cold, damp and gray. There are periods in which temperatures remain around freezing even during the day, especially in December and January. Besides, the sky remains overcast for long periods.
Typically, by the second half of February, the temperature tends to increase, and highs exceed quite often 10 °C (50 °F).
Fog, which was once very common, has become rarer, and is formed only in periods with Atlantic high pressure.
Snow in Veneto is rarer than in Lombardy and Emilia-Romagna, however, in Vicenza it is a little more abundant than in the other lowland cities of Veneto, given its proximity to the hills. On average, 15 cm (6 in) of snow fall per year (while in Padua, Venice and Verona, the average is about 10 cm or 4 in). In January 1985, the snow reached 70 cm (27.5 in) in height.
Every now and then,
cold air masses from Eastern Europe can bring quite intense frosts, though the temperature rarely drops below -10 °C (14 °F). However, the temperature reached -18.5 °C (-1.5 °F) in February 1956 and -20 °C (-4 °F) in January 1985 (record).
Summer, from June to August, is hot and muggy, and generally sunny. The heat is felt because of high humidity, although a bit of breeze comes from the sea in the afternoon.
Sometimes, an Atlantic front, able to bring cool and rainy weather, can affect this area even in summer; more often, on sunny days, thunderstorms can erupt in the afternoon or evening.
During
heat waves, which are becoming increasingly more frequent, the temperature can reach or exceed 37/38 °C (98/100 °F).
Best Time
The
best period to visit Vicenza is that of spring and early summer, and in particular, from mid-April to mid-June. September, too, is a good month. However, you have to take into account some rainy days in both periods.
Summer can be hot, although some days can be acceptable, especially in June. In summer, and sometimes in May, sudden thunderstorms in the afternoon or evening must be put into account.
Vicenza - Climate data
In Vicenza, the
average temperature of the coldest month (January) is of
3.3 °C, that of the warmest month (July) is of
24.5 °C. Here are the average temperatures.
Vicenza - Average temperatures (1991-2020) |
| Month | Min | Max | Mean |
|---|
| January | -1.2 | 7.8 | 3.3 |
|---|
| February | 0.9 | 9.8 | 5.3 |
|---|
| March | 3.9 | 14.5 | 9.2 |
|---|
| April | 7.9 | 19.4 | 13.6 |
|---|
| May | 12.7 | 23.7 | 18.2 |
|---|
| June | 16.8 | 28.3 | 22.5 |
|---|
| July | 18.5 | 30.5 | 24.5 |
|---|
| August | 18 | 30.2 | 24.1 |
|---|
| September | 13.9 | 25.2 | 19.5 |
|---|
| October | 10 | 19.2 | 14.6 |
|---|
| November | 4.7 | 12.7 | 8.7 |
|---|
| December | 0 | 8.2 | 4.1 |
|---|
| Year | 8.9 | 19.2 | 14 |
|---|
amounts to
1060 millimeters per year: it is therefore quite abundant. It ranges from
70 millimeters in the driest month (February) to
115 millimeters in the wettest one (October). Here is the average precipitation.
Vicenza - Average precipitation| Month | Days |
|---|
| January | 75 | 7 |
|---|
| February | 70 | 5 |
|---|
| March | 75 | 6 |
|---|
| April | 95 | 10 |
|---|
| May | 100 | 10 |
|---|
| June | 105 | 9 |
|---|
| July | 75 | 7 |
|---|
| August | 80 | 7 |
|---|
| September | 95 | 6 |
|---|
| October | 115 | 8 |
|---|
| November | 95 | 7 |
|---|
| December | 80 | 6 |
|---|
| Year | 1060 | 88 |
|---|
There are on average around 2250
sunshine hours per year. Here are the average hours of sunshine per day.
Vicenza - Sunshine hours| Month | Average | Total |
|---|
| January | 3 | 100 |
|---|
| February | 5 | 140 |
|---|
| March | 5.5 | 165 |
|---|
| April | 6.5 | 190 |
|---|
| May | 8 | 240 |
|---|
| June | 9 | 265 |
|---|
| July | 10 | 305 |
|---|
| August | 9.5 | 290 |
|---|
| September | 7 | 210 |
|---|
| October | 5 | 160 |
|---|
| November | 3.5 | 105 |
|---|
| December | 3 | 85 |
|---|
| Year | 6.2 | 2250 |
|---|