Select units of measurement for the temperature and rainfall tables (metric or imperial).
Average weather, temperature, rainfall, sunshine hours

In Urbino there is a
temperate climate, with quite cold winters and warm summers.
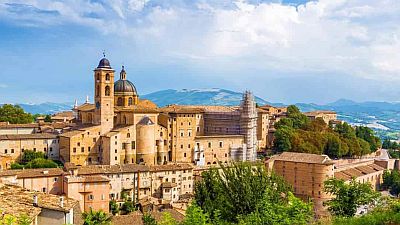
The town is located in central-northern Italy, at an altitude of 485 meters (1,600 feet), on the hills of the pre-Apennines, and 30 km (18 mi) from the coast. Together with Pesaro, Urbino is a provincial capital of the Marche region.

The
winter, from December to February, is quite cold.
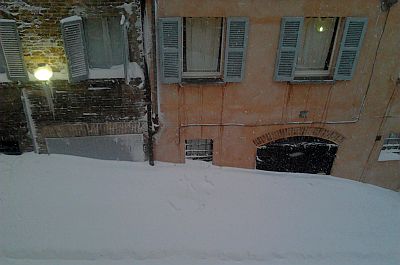
During the irruptions of cold air from the north-east, there may be
snowfalls, sometimes heavy. During the snowiest years, even more than two meters (78.5 in) of snow fell in total. In February 2012 there was a record snowfall, in fact, 325 cm (128 in) fell in two weeks, of which 95 cm (37.5 in) in 24 hours, and the maximum height reached by the snow was 2 meters (78.5 in).
During
cold spells, which are becoming rarer due to global warming, the temperature can drop by several degrees below freezing. In January 1985 it dropped to -12.4 °C (9.7 °F).

The
summer, from June to August, is hot and sunny, with rare rainy days and a few thunderstorms coming from the Apennines.
The altitude tempers the heat a bit, moreover, the humidity is not as high as on the coast. However, it can sometimes get very hot. The heat record, 39.4 °C (102.9 °F), was set in late June 2022 and in August 2017.
Best Time
To visit Urbino, you can choose the period from mid-May to mid-June and the month of September. In July and August, the heat is usually bearable, but sometimes it can be intense.
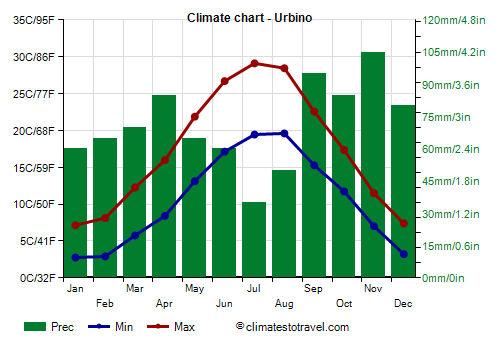
Urbino - Climate data
In Urbino, the
average temperature of the coldest month (January) is of
5 °C, that of the warmest month (July) is of
24.3 °C. Here are the average temperatures.
Urbino - Average temperatures (1991-2012) |
| Month | Min | Max | Mean |
|---|
| January | 2.8 | 7.1 | 5 |
|---|
| February | 2.9 | 8.1 | 5.5 |
|---|
| March | 5.8 | 12.3 | 9 |
|---|
| April | 8.4 | 16 | 12.2 |
|---|
| May | 13.1 | 21.9 | 17.5 |
|---|
| June | 17.1 | 26.7 | 21.9 |
|---|
| July | 19.4 | 29.1 | 24.3 |
|---|
| August | 19.6 | 28.4 | 24 |
|---|
| September | 15.3 | 22.6 | 18.9 |
|---|
| October | 11.7 | 17.4 | 14.5 |
|---|
| November | 7 | 11.5 | 9.3 |
|---|
| December | 3.2 | 7.4 | 5.3 |
|---|
| Year | 10.6 | 17.4 | 13.95 |
|---|
amounts to
855 millimeters per year: so, it is at an intermediate level. It ranges from
35 millimeters in the driest month (July) to
105 millimeters in the wettest one (November). Here is the average precipitation.
Urbino - Average precipitation| Month | Days |
|---|
| January | 60 | 8 |
|---|
| February | 65 | 8 |
|---|
| March | 70 | 8 |
|---|
| April | 85 | 9 |
|---|
| May | 65 | 8 |
|---|
| June | 60 | 6 |
|---|
| July | 35 | 4 |
|---|
| August | 50 | 5 |
|---|
| September | 95 | 8 |
|---|
| October | 85 | 9 |
|---|
| November | 105 | 10 |
|---|
| December | 80 | 9 |
|---|
| Year | 855 | 91 |
|---|
There are on average around 2130
sunshine hours per year. Here are the average hours of sunshine per day.
Urbino - Sunshine hours| Month | Average | Total |
|---|
| January | 3 | 100 |
|---|
| February | 3.5 | 105 |
|---|
| March | 4.5 | 135 |
|---|
| April | 6 | 175 |
|---|
| May | 7 | 225 |
|---|
| June | 8.5 | 250 |
|---|
| July | 10.5 | 325 |
|---|
| August | 9 | 280 |
|---|
| September | 7 | 215 |
|---|
| October | 4.5 | 145 |
|---|
| November | 3 | 85 |
|---|
| December | 3 | 85 |
|---|
| Year | 5.8 | 2130 |
|---|