Select units of measurement for the temperature and rainfall tables (metric or imperial).
Average weather, temperature, rainfall, sunshine hours

In Tempio Pausania, the climate is
almost Mediterranean, with quite mild, rainy winters and hot, sunny summers.
As in the rest of Sardinia, both the mistral (cool, dry wind from the north-west) and the sirocco (warm, humid wind from the south-east) can blow.
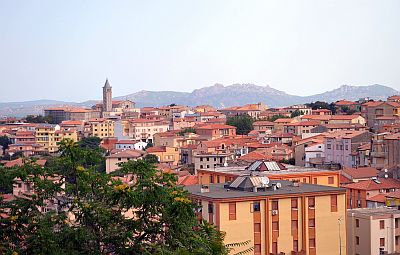
The town is located in the north of Sardinia, at an altitude of 565 metres (1,855 ft), in the province of Sassari, in the Gallura area.
Due to its position on the northwest side of a mountain massif, the rains are more abundant than in other areas of Sardinia.
In addition, the altitude cools the climate slightly, and in winter, during cold air irruptions, it can sometimes snow. In February 1956, the temperature dropped to -8.5 °C (16.5 °F).
In summer, on the other hand, when the sirocco blows it can get very hot, and in the worst moments, the temperatures can reach 38/40 °C (100/104 °F).

Nearby we find Mount Limbara, 1,362 meters (4,468 ft) high. Here are the average temperatures.
Monte Limbara - Average temperatures|
| Month | Min | Max | Mean |
|---|
| January | 0.1 | 3.6 | 1.9 |
|---|
| February | -0.5 | 3 | 1.3 |
|---|
| March | 0.7 | 6.3 | 3.5 |
|---|
| April | 4.2 | 9.1 | 6.6 |
|---|
| May | 8.3 | 14.6 | 11.4 |
|---|
| June | 12.7 | 18.7 | 15.7 |
|---|
| July | 16 | 21.9 | 18.9 |
|---|
| August | 16 | 23 | 19.5 |
|---|
| September | 11.7 | 17.2 | 14.4 |
|---|
| October | 9.3 | 13.6 | 11.5 |
|---|
| November | 4.2 | 7.7 | 5.9 |
|---|
| December | 0.9 | 4.2 | 2.6 |
|---|
| Year | 7 | 12 | 9.45 |
|---|
Best Time
To visit Tempio Pausania, you can choose the periods from mid-April to mid-June and from September to early October. In June, the weather is often nice, but it can sometimes get hot, especially in the second half of the month.
Monte Limbara - Climate data
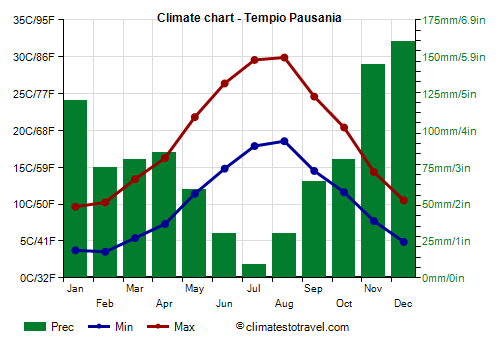
In Tempio Pausania, the
average temperature of the coldest month (January) is of
6.7 °C, that of the warmest month (August) is of
24.2 °C. Here are the average temperatures.
Tempio Pausania - Average temperatures (1991-2011) |
| Month | Min | Max | Mean |
|---|
| January | 3.8 | 9.7 | 6.7 |
|---|
| February | 3.6 | 10.2 | 6.9 |
|---|
| March | 5.4 | 13.4 | 9.4 |
|---|
| April | 7.3 | 16.3 | 11.8 |
|---|
| May | 11.4 | 21.8 | 16.6 |
|---|
| June | 14.8 | 26.4 | 20.6 |
|---|
| July | 17.9 | 29.6 | 23.7 |
|---|
| August | 18.6 | 29.9 | 24.2 |
|---|
| September | 14.5 | 24.6 | 19.6 |
|---|
| October | 11.6 | 20.4 | 16 |
|---|
| November | 7.7 | 14.4 | 11 |
|---|
| December | 4.9 | 10.5 | 7.7 |
|---|
| Year | 10.2 | 19 | 14.55 |
|---|
amounts to
935 millimeters per year: so, it is at an intermediate level. It ranges from
8.8 millimeters in the driest month (July) to
160 millimeters in the wettest one (December). Here is the average precipitation.
Tempio Pausania - Average precipitation| Month | Days |
|---|
| January | 120 | 9 |
|---|
| February | 75 | 10 |
|---|
| March | 80 | 9 |
|---|
| April | 85 | 11 |
|---|
| May | 60 | 7 |
|---|
| June | 30 | 4 |
|---|
| July | 9 | 2 |
|---|
| August | 30 | 2 |
|---|
| September | 65 | 6 |
|---|
| October | 80 | 9 |
|---|
| November | 145 | 11 |
|---|
| December | 160 | 8 |
|---|
| Year | 935 | 88 |
|---|