Select units of measurement for the temperature and rainfall tables (metric or imperial).
Average weather, temperature, rainfall, sunshine hours

The climate of Taranto is
Mediterranean, with mild, relatively rainy winters and hot, sunny summers.
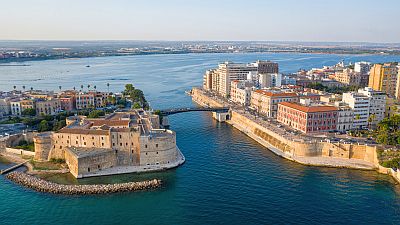
The city is located in southeastern Italy, in Apulia (Puglia), on the coast of the gulf of the same name. The historic nucleus is divided between a small peninsula and an even smaller island. To the east is a small bay divided into two, the Mar Grande and the Mar Piccolo (Big Sea and Little Sea).
On the mainland is the industrial city, with a large steel plant that causes severe environmental pollution.
About 15 km (9 mi) to the north is the Terra delle Gravine regional natural park, with hills over 400 meters (1,300 ft) high.
Winter, from December to February, is mild, and is characterized by sunny periods alternating with rainy periods.
Despite the mild climate, due to the proximity to the Balkan peninsula, there can be
cold periods, usually of short duration, in which the temperature approaches freezing. In these cases, it can even
snow, although due to the local conditions, with water all around and hills to the north, snow in Taranto is rarer than in the rest of Puglia.
However, occasionally there may be a snowfall of some importance, for example, at the end of December 2014, 15 cm (6 in) of snow fell.
During cold spells, the temperature generally drops to -2/-3 °C (27/28 °F), but occasionally it can drop to lower values. At Grottaglie airport, located in the countryside, 15 km (9 mi) away from the coast, the temperature dropped to -10 °C (14 °F) in January 1979, although it rarely drops below -5 °C (23 °F).
 Summer
, from June to August, is hot and sunny, with the sea breeze blowing regularly in the afternoon and with rare rains.
During
heat waves of African origin, the temperature can reach 38-40 °C (100-104 °F).
Best Time
To visit Taranto, you can choose the periods from mid-April to mid-May and from mid-September to mid-October, since in summer it can get very hot. It must be said that in both periods there may be rainy days.
The best months for a beach holiday on the coast are July and August. In June, the days are long and the weather is often good, but the sea is still a bit cool. You can still go in September, in fact the sea is still quite warm, but the days get shorter and the first waves of bad weather can occur, especially in the second half of the month.
Taranto - Climate data
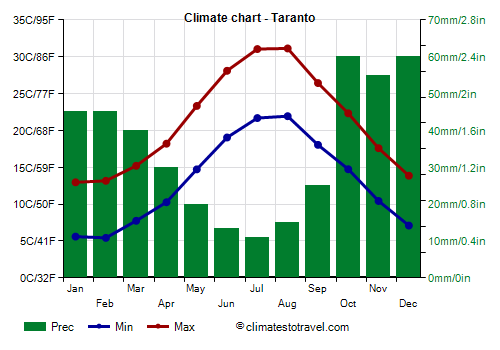
In Taranto, the
average temperature of the coldest month (January) is of
9.3 °C, that of the warmest month (August) is of
26.5 °C. Here are the average temperatures.
Taranto - Average temperatures (1991-2012) |
| Month | Min | Max | Mean |
|---|
| January | 5.6 | 13 | 9.3 |
|---|
| February | 5.4 | 13.2 | 9.3 |
|---|
| March | 7.8 | 15.2 | 11.5 |
|---|
| April | 10.3 | 18.2 | 14.2 |
|---|
| May | 14.7 | 23.3 | 19 |
|---|
| June | 19 | 28.1 | 23.6 |
|---|
| July | 21.7 | 31 | 26.4 |
|---|
| August | 21.9 | 31.1 | 26.5 |
|---|
| September | 18 | 26.4 | 22.2 |
|---|
| October | 14.8 | 22.3 | 18.5 |
|---|
| November | 10.4 | 17.6 | 14 |
|---|
| December | 7.1 | 13.9 | 10.5 |
|---|
| Year | 13.1 | 21.2 | 17.1 |
|---|
amounts to
415 millimeters per year: it is therefore quite scarce. It ranges from
11 millimeters in the driest month (July) to
60 millimeters in the wettest ones (October, December) Here is the average precipitation.
Taranto - Average precipitation| Month | Days |
|---|
| January | 45 | 6 |
|---|
| February | 45 | 6 |
|---|
| March | 40 | 5 |
|---|
| April | 30 | 5 |
|---|
| May | 20 | 4 |
|---|
| June | 14 | 2 |
|---|
| July | 11 | 2 |
|---|
| August | 15 | 3 |
|---|
| September | 25 | 3 |
|---|
| October | 60 | 7 |
|---|
| November | 55 | 6 |
|---|
| December | 60 | 7 |
|---|
| Year | 415 | 56 |
|---|
The
sea temperature ranges from
14 °C in February to
26 °C in August. Here are the average sea temperatures.
Taranto - Sea temperature| Month |
|---|
| January | 14.5 |
|---|
| February | 14 |
|---|
| March | 14.5 |
|---|
| April | 15.5 |
|---|
| May | 18.5 |
|---|
| June | 22 |
|---|
| July | 25 |
|---|
| August | 26 |
|---|
| September | 24 |
|---|
| October | 21.5 |
|---|
| November | 18"> |
|---|
| December | 15.5 |
|---|
| Year | 19.1 |
|---|
There are on average around 2690
sunshine hours per year. Here are the average hours of sunshine per day.
Taranto - Sunshine hours| Month | Average | Total |
|---|
| January | 4.5 | 135 |
|---|
| February | 5 | 140 |
|---|
| March | 6 | 180 |
|---|
| April | 7 | 215 |
|---|
| May | 9 | 280 |
|---|
| June | 10.5 | 310 |
|---|
| July | 11.5 | 355 |
|---|
| August | 10.5 | 325 |
|---|
| September | 8.5 | 260 |
|---|
| October | 7 | 210 |
|---|
| November | 5 | 150 |
|---|
| December | 4 | 125 |
|---|
| Year | 7.4 | 2690 |
|---|