Select units of measurement for the temperature and rainfall tables (metric or imperial).
Average weather, temperature, rainfall, sunshine hours

The climate of Savona is
Mediterranean, with mild, relatively rainy winters and warm, sunny summers.
The city is located in north-western Italy, on the western Ligurian coast, 30 km (18 mi) away from Genoa as the crow flies.
Savona's climate is a little colder than the rest of the Riviera, given that the Ligurian Apennines to the north are lower, and therefore can sometimes let the
cold wind blow in from the Piedmont plain, especially in winter.
Winter, from December to February, is mild; in particular, periods of high pressure are pleasant, and the sun shines, while the Po Valley is shrouded in fog.
In contrast, in periods of bad weather, with the north wind, cold air from the Po Valley manages to climb over the Apennines and reach the city, so there can be cold and rainy days.
On colder periods, for the same reason, it may even
snow. Together with Genoa, Savona is one of the two cities of the Ligurian Riviera where snow is more frequent, because in some situations, cold air manages to be channeled between the mountains. So, even if snow is rare, occasionally there can be a snowfall.
Typically, the temperature drops slightly below freezing on the coldest nights, however, in February 1991 it reached -5 °C (23 °F).
 Summer
, from June to August, is warm to hot and sunny.
Some weather disturbances may pass over the city even in summer, especially in June and in late August, while on sunny days, some thunderstorms may reach the coast after forming in the interior.
Generally, the heat is not excessive because of the sea breeze, but we cannot exclude some particularly sultry periods, with highs of 32/33 °C (90/91 °F).
The hottest days occur with the north wind and therefore with lower humidity. In recent years, the temperature has sometimes reached 37 °C, while in August 2003 it reached 38.4 °C (101 °F).
Best Time
The
best times to visit Savona are spring and early summer, in particular, from mid-April to mid-June. September, too, is a good month, especially in the first half, while later, Atlantic depressions become more frequent.
In the height of summer, in July and August, it can be hot, although less frequently than in other parts of Italy.
For a beach holiday on the Western Ligurian Riviera, the best months are exactly July and August.
Savona - Climate data
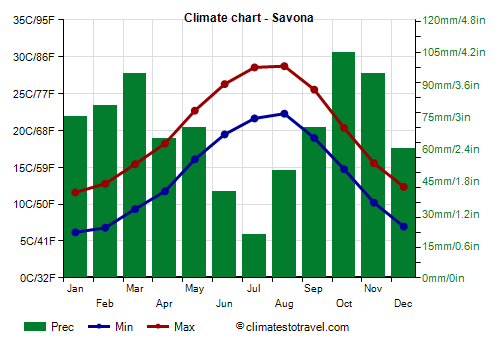
In Savona, the
average temperature of the coldest month (January) is of
8.9 °C, that of the warmest month (August) is of
25.5 °C. Here are the average temperatures.
Savona - Average temperatures (1991-2012) |
| Month | Min | Max | Mean |
|---|
| January | 6.2 | 11.6 | 8.9 |
|---|
| February | 6.8 | 12.8 | 9.8 |
|---|
| March | 9.3 | 15.4 | 12.4 |
|---|
| April | 11.8 | 18.2 | 15 |
|---|
| May | 16.1 | 22.7 | 19.4 |
|---|
| June | 19.5 | 26.3 | 22.9 |
|---|
| July | 21.6 | 28.6 | 25.1 |
|---|
| August | 22.3 | 28.7 | 25.5 |
|---|
| September | 19 | 25.6 | 22.3 |
|---|
| October | 14.8 | 20.4 | 17.6 |
|---|
| November | 10.2 | 15.6 | 12.9 |
|---|
| December | 7 | 12.4 | 9.7 |
|---|
| Year | 13.7 | 19.9 | 16.8 |
|---|
amounts to
825 millimeters per year: so, it is at an intermediate level. It ranges from
20 millimeters in the driest month (July) to
105 millimeters in the wettest one (October). Here is the average precipitation.
Savona - Average precipitation| Month | Days |
|---|
| January | 75 | 6 |
|---|
| February | 80 | 5 |
|---|
| March | 95 | 7 |
|---|
| April | 65 | 6 |
|---|
| May | 70 | 7 |
|---|
| June | 40 | 5 |
|---|
| July | 20 | 2 |
|---|
| August | 50 | 4 |
|---|
| September | 70 | 5 |
|---|
| October | 105 | 7 |
|---|
| November | 95 | 7 |
|---|
| December | 60 | 5 |
|---|
| Year | 825 | 66 |
|---|
The
sea temperature ranges from
13 °C in February to
25 °C in August. Here are the average sea temperatures.
Savona - Sea temperature| Month |
|---|
| January | 13.5 |
|---|
| February | 13 |
|---|
| March | 13.5 |
|---|
| April | 14.5 |
|---|
| May | 18 |
|---|
| June | 21.5 |
|---|
| July | 24 |
|---|
| August | 25 |
|---|
| September | 22.5 |
|---|
| October | 20 |
|---|
| November | 17"> |
|---|
| December | 14.5 |
|---|
| Year | 18.1 |
|---|
There are on average around 2095
sunshine hours per year. Here are the average hours of sunshine per day.
Savona - Sunshine hours| Month | Average | Total |
|---|
| January | 4 | 120 |
|---|
| February | 4.5 | 125 |
|---|
| March | 5 | 160 |
|---|
| April | 6 | 175 |
|---|
| May | 6.5 | 195 |
|---|
| June | 7 | 215 |
|---|
| July | 8.5 | 265 |
|---|
| August | 8 | 245 |
|---|
| September | 6.5 | 195 |
|---|
| October | 5.5 | 165 |
|---|
| November | 4 | 115 |
|---|
| December | 3.5 | 115 |
|---|
| Year | 5.7 | 2095 |
|---|