
 Climates to travel
 World climate guide
 
 
 Home
 Africa
 N.America
 S.America
 Antarctica
 Asia
 Caribbean
 Europe
 M.East
 Oceania
 All the countries
 Home
 Africa
 N.America
 S.America
 Antarctica
 Asia
 Caribbean
 Europe
 M.East
 Oceania
 All the countries

Climate - San Candido (Italy)


Average weather, temperature, rainfall, sunshine hours

Flag - Italy

San Candido (Italy), position the map


You are here: Home --> Europe --> Italy --> San Candido
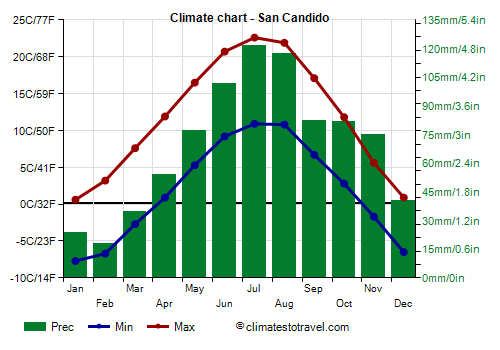


Climate chart - San Candido
In San Candido, there is a moderately continental climate, with cold winters, in which the temperature is often below freezing, and mild or pleasantly warm summers.
San Candido (Innichen in German) is a town located in the province of Bolzano (South Tyrol), in the Puster Valley (Val Pusteria), at an altitude of 1,180 meters (3,870 feet) and 46 degrees north latitude.
To the west is Dobbiaco, while to the southeast is Sesto. The border with Austria is only 6 km (3.7 in) to the east.
To the south is the Rocca dei Baranci (Haunold), a mountain of 2,966 meters (9,730 feet) belonging to the Sesto Dolomites, and further south, belonging to the same group, the Tre Cime di Lavaredo, mountains that reach 3,000 meters (9,840 feet) in height.
The average temperature of the coldest month (January) is of -3.6 °C (25.5 °F), that of the warmest month (July) is of 16.8 °C (62.2 °F). Here are the average temperatures.
San Candido - Average temperatures (1991-2020)
MonthMin (°C)Max (°C)Mean (°C)Min (°F)Max (°F)Mean (°F)
January-70-3.6193325.6
February-63-1.8203728.8
March-382.5274636.5
April1126.4345343.6
May51610.9426251.7
June92115496958.9
July112216.8527262.2
August112216.4527161.4
September71711.9446353.5
October3127.4375345.3
November-251.9294235.5
December-60-2.9213326.8
Year211.66.7535.652.944

Precipitation amounts to 795 millimeters (31 inches) per year. Winter is the driest season, while summer is the rainiest season due to afternoon thunderstorms. Here is the average precipitation.
San Candido - Average precipitation
MonthMillimetersInchesDays
January2514
February150.64
March301.25
April5028
May75311
June1003.912
July1204.712
August1054.112
September853.38
October803.18
November7537
December351.45
Year79531.397

Winter is cold. In periods of good weather, the sun can come out, while in the Po valley and in the lowlands of central Europe, mists and cloud layers often form at low altitude.
Sometimes there can be cold spells, in which the temperature can drop down to -20 °C (-4 °F) or even below. The coldest record is -30 °C (-22 °F) and was set in January 1985.
In winter, snowfalls are quite frequent, but are generally not abundant because the level of precipitation is low. It typically snows from November to March, however, it can occasionally snow in early May, as it did in 2009, or in late September, as it did in 2006.
In summer, temperatures are pleasant and suitable for outdoor activities, although sometimes there can be rains and thunderstorms, and it can get cold at night due to altitude.
Occasionally (but less than in the lowlands), there may be brief hot periods. There may be periods in which the temperature reaches 28/30 °C (82/86 °F), which are becoming more frequent due to global warming. The highest record is 32.4 °C (90.3 °F) and was set in July 1983.

San Candido

On average, there are around 2,000 sunshine hours per year. Here are the average sunshine hours per day.
San Candido - Sunshine hours
MonthAverageTotal
January4130
February5140
March5160
April5.5160
May6185
June6.5190
July7.5225
August7215
September6.5190
October6185
November4.5130
December4125
Year5.62045

Best Time


You can go to San Candido both in winter, perhaps for skiing, and in summer, perhaps for trekking in the mountains and to escape the heat of the plains.


San Candido - Weather by month

Based on the period 1991-2020
(January - February - March - April - May - June - July - August - September - October - November - December)


In January, the coldest month of the year, the weather in San Candido is usually very cold. The average temperature is of -3.6 °C (26 °F), with a minimum of -7.4 °C (18.6 °F) and a maximum of 0.3 °C (32.5 °F).
On the coldest nights of the month, the temperature usually drops to around -16 °C (3 °F). However, it dropped to -22.6 °C (-8.7 °F) in January 1999.
On the warmest days of the month, the temperature usually reaches around 6.5 °C (44 °F). However, it reached 11.4 °C (52.5 °F) in January 2013.
Precipitation amounts to 25 mm (1 in), distributed over 4 days.
The day lasts on average 9 hours and 0 minutes.
There are on average 4 hours of sunshine per day. So, the sun shines 47% of the time.
The average humidity is 76%. Hence, the air is normally humid.
The average wind speed is 3 kph (2 mph).


In February, the weather in San Candido is usually very cold. The average temperature is of -1.8 °C (29 °F), with a minimum of -6.5 °C (20.4 °F) and a maximum of 2.9 °C (37.2 °F).
On the coldest nights of the month, the temperature usually drops to around -14.5 °C (6 °F). However, it dropped to -21.4 °C (-6.5 °F) in February 1999.
On the warmest days of the month, the temperature usually reaches around 9.5 °C (49.5 °F). However, it reached 14.6 °C (58.3 °F) in February 2012.
Precipitation amounts to 15 mm (0.6 in), distributed over 4 days.
The day lasts on average 10 hours and 20 minutes.
There are on average 5 hours of sunshine per day. So, the sun shines 48% of the time.
The average humidity is 67%.
The average wind speed is 4 kph (2 mph).


In March, the weather in San Candido is usually cold. The average temperature is of 2.5 °C (37 °F), with a minimum of -2.6 °C (27.4 °F) and a maximum of 7.6 °C (45.7 °F).
On the coldest nights, which normally occur at the beginning of the month, the temperature usually drops to around -11 °C (12.5 °F). However, it dropped to -22 °C (-7.6 °F) in March 2005.
On the warmest days, which normally occur at the end of the month, the temperature usually reaches around 15 °C (59 °F). However, it reached 18 °C (64.4 °F) in March 2012.
Precipitation amounts to 30 mm (1.2 in), distributed over 5 days.
The day lasts on average 12 hours and 0 minutes.
There are on average 5 hours of sunshine per day. So, the sun shines 42% of the time.
The average humidity is 60%.
The average wind speed is 4 kph (3 mph).


In April, the weather in San Candido is usually quite cold. The average temperature is of 6.4 °C (44 °F), with a minimum of 1 °C (33.8 °F) and a maximum of 11.9 °C (53.4 °F).
On the coldest nights, which normally occur at the beginning of the month, the temperature usually drops to around -5.5 °C (21.5 °F). However, it dropped to -13 °C (8.6 °F) in April 2003.
On the warmest days, which normally occur at the end of the month, the temperature usually reaches around 19 °C (66.5 °F). However, it reached 23.6 °C (74.5 °F) in April 2012.
Precipitation amounts to 50 mm (2 in), distributed over 8 days.
The day lasts on average 13 hours and 35 minutes.
There are on average 5.5 hours of sunshine per day. So, the sun shines 40% of the time.
The average humidity is 58%.
The average wind speed is 4 kph (3 mph).


In May, the weather in San Candido is usually mild. The average temperature is of 10.9 °C (52 °F), with a minimum of 5.4 °C (41.7 °F) and a maximum of 16.5 °C (61.7 °F).
On the coldest nights, which normally occur at the beginning of the month, the temperature usually drops to around -0.5 °C (30.5 °F). However, it dropped to -4.5 °C (23.9 °F) in May 2019.
On the warmest days, which normally occur at the end of the month, the temperature usually reaches around 24 °C (75 °F). However, it reached 28.6 °C (83.5 °F) in May 2009.
Precipitation amounts to 75 mm (3 in), distributed over 11 days.
The day lasts on average 15 hours and 5 minutes. So the days are long.
There are on average 6 hours of sunshine per day. So, the sun shines 40% of the time.
The average humidity is 59%.
The average wind speed is 4 kph (3 mph).


In June, the weather in San Candido is usually very mild. The average temperature is of 15.0 °C (59 °F), with a minimum of 9.3 °C (48.7 °F) and a maximum of 20.6 °C (69.1 °F).
On the coldest nights, which normally occur at the beginning of the month, the temperature usually drops to around 3 °C (37.5 °F). However, it dropped to -1.2 °C (29.8 °F) in June 2006.
On the warmest days, which normally occur at the end of the month, the temperature usually reaches around 27.5 °C (81.5 °F). However, it reached 32.3 °C (90.1 °F) in June 2019.
Precipitation amounts to 100 mm (3.9 in), distributed over 12 days.
The day lasts on average 15 hours and 50 minutes. So the days are long. June 21, the summer solstice, is the longest day of the year in the Northern Hemisphere.
There are on average 6.5 hours of sunshine per day. So, the sun shines 40% of the time.
The average humidity is 59%.
The average wind speed is 4 kph (2 mph).


In July, the warmest month of the year, the weather in San Candido is usually very mild. The average temperature is of 16.8 °C (62 °F), with a minimum of 11.1 °C (51.9 °F) and a maximum of 22.4 °C (72.4 °F).
On the coldest nights of the month, the temperature usually drops to around 5.5 °C (41.5 °F). However, it dropped to 1.8 °C (35.2 °F) in July 1993.
On the warmest days of the month, the temperature usually reaches around 28 °C (83 °F). However, it reached 31.2 °C (88.2 °F) in July 2015.
Precipitation amounts to 120 mm (4.7 in), distributed over 12 days.
The day lasts on average 15 hours and 25 minutes. So the days are long.
There are on average 7.5 hours of sunshine per day. So, the sun shines 47% of the time.
The average humidity is 60%.
The average wind speed is 4 kph (2 mph).


In August, the weather in San Candido is usually very mild. The average temperature is of 16.4 °C (61 °F), with a minimum of 11 °C (51.7 °F) and a maximum of 21.8 °C (71.2 °F).
On the coldest nights of the month, the temperature usually drops to around 5 °C (41 °F). However, it dropped to 0 °C (32 °F) in August 1995.
On the warmest days of the month, the temperature usually reaches around 27 °C (81 °F). However, it reached 31.2 °C (88.2 °F) in August 2013.
Precipitation amounts to 105 mm (4.1 in), distributed over 12 days.
The day lasts on average 14 hours and 5 minutes. So the days are long.
There are on average 7 hours of sunshine per day. So, the sun shines 50% of the time.
The average humidity is 64%.
The average wind speed is 3 kph (2 mph).


In September, the weather in San Candido is usually mild. The average temperature is of 11.9 °C (53 °F), with a minimum of 6.9 °C (44.4 °F) and a maximum of 17 °C (62.5 °F).
On the coldest nights, which normally occur at the end of the month, the temperature usually drops to around 0.5 °C (32.5 °F). However, it dropped to -6 °C (21.2 °F) in September 2002.
On the warmest days, which normally occur at the beginning of the month, the temperature usually reaches around 22.5 °C (72.5 °F). However, it reached 26.2 °C (79.2 °F) in September 2006.
Precipitation amounts to 85 mm (3.3 in), distributed over 8 days.
The day lasts on average 12 hours and 30 minutes.
There are on average 6.5 hours of sunshine per day. So, the sun shines 51% of the time.
The average humidity is 67%.
The average wind speed is 3 kph (2 mph).


In October, the weather in San Candido is usually quite mild. The average temperature is of 7.4 °C (45 °F), with a minimum of 3 °C (37.4 °F) and a maximum of 11.7 °C (53.1 °F).
On the coldest nights, which normally occur at the end of the month, the temperature usually drops to around -4 °C (24.5 °F). However, it dropped to -12 °C (10.4 °F) in October 1997.
On the warmest days, which normally occur at the beginning of the month, the temperature usually reaches around 18 °C (64.5 °F). However, it reached 21.4 °C (70.5 °F) in October 2011.
Precipitation amounts to 80 mm (3.1 in), distributed over 8 days.
The day lasts on average 10 hours and 50 minutes.
There are on average 6 hours of sunshine per day. So, the sun shines 55% of the time.
The average humidity is 74%. Hence, the air is normally humid.
The average wind speed is 3 kph (2 mph).


In November, the weather in San Candido is usually cold. The average temperature is of 2.0 °C (36 °F), with a minimum of -1.5 °C (29.2 °F) and a maximum of 5.4 °C (41.8 °F).
On the coldest nights, which normally occur at the end of the month, the temperature usually drops to around -9 °C (15.5 °F). However, it dropped to -16 °C (3.2 °F) in November 1995.
On the warmest days, which normally occur at the beginning of the month, the temperature usually reaches around 12 °C (53.5 °F). However, it reached 17 °C (62.6 °F) in November 2020.
Precipitation amounts to 75 mm (3 in), distributed over 7 days.
The day lasts on average 9 hours and 25 minutes.
There are on average 4.5 hours of sunshine per day. So, the sun shines 47% of the time.
The average humidity is 78%. Hence, the air is normally humid.
The average wind speed is 3 kph (2 mph).


In December, the weather in San Candido is usually very cold. The average temperature is of -2.9 °C (27 °F), with a minimum of -6.3 °C (20.7 °F) and a maximum of 0.5 °C (32.9 °F).
On the coldest nights of the month, the temperature usually drops to around -15 °C (5.5 °F). However, it dropped to -20.4 °C (-4.7 °F) in December 2003.
On the warmest days of the month, the temperature usually reaches around 6.5 °C (43.5 °F). However, it reached 11.4 °C (52.5 °F) in December 2016.
Precipitation amounts to 35 mm (1.4 in), distributed over 5 days.
The day lasts on average 8 hours and 35 minutes. December 21, the winter solstice, is the shortest day of the year in the Northern Hemisphere.
There are on average 4 hours of sunshine per day. So, the sun shines 48% of the time.
The average humidity is 78%. Hence, the air is normally humid.
The average wind speed is 2 kph (1 mph).

© Copyright Climatestotravel.com. 

Back to Europe --> Italy

All the countries


Share this page:
Facebook Twitter LinkedIn Whatsapp Email


 Continents:
 Africa
 North America
 South America
 Antarctica
 Asia
 Caribbean
 Europe
 Middle East
 Oceania

Search in the website:

Home About Contact Us Link Policy
Home
About
Contact Us
Link
Policy