Select units of measurement for the temperature and rainfall tables (metric or imperial).
Average weather, temperature, rainfall, sunshine hours

The climate of Rieti can be defined as
transitional Mediterranean, given that it has relatively cold winters and hot, sunny summers.
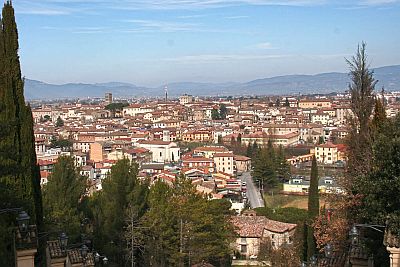
The city is located in central Italy, in the north-east of the Lazio region, 400 meters (1,300 feet) above sea level. We are on the south-eastern edge of the Rieti plain, a basin surrounded by mountains. To the east we find the Reatini Mountains, whose highest peak is
Mount Terminillo, 2,217 metres (7,274 ft) high.
The
winter, from December to February, is quite cold.
There are quite mild periods, in which the Atlantic currents prevail, during which there can also be rainy days.
In periods of high pressure, especially in December, fog can form, which can sometimes persist even during the day.
Instead, the cold wind from the north, the tramontana, can bring clear but cold days.
Snow in Rieti is more frequent than in the other cities of Lazio. In past decades, an average of 25 cm (10 in) of snow fell per year.
During cold snaps, the temperature can drop several degrees below freezing. In January 1985 it dropped to -20 °C (-4 °F), while in February 2012 it dropped to -14 °C (7 °F).

The
summer, from June to August, is hot and sunny, with rare rainy days and some thunderstorms coming from the Apennines.
Generally, the humidity is not high and the air becomes cool at night, however, there can also be very hot periods, with highs of 37/38 °C (99/100 °F). In August 2017, the temperature reached 40.4 °C (104.7 °F).
Best Time
The
best times to visit Rieti are spring and autumn, in particular, from May to mid-June and in the month of September. In summer, there are periods when it is not too hot, alternating with others in which there is intense heat.
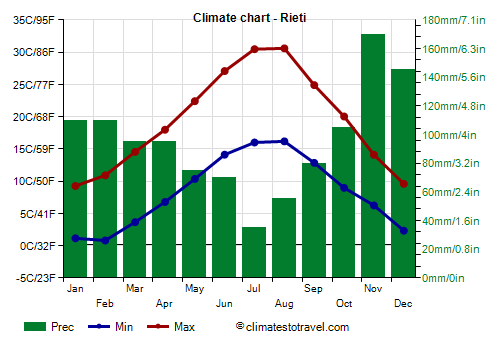
Rieti - Climate data
In Rieti, the
average temperature of the coldest month (January) is of
5.2 °C, that of the warmest month (August) is of
23.4 °C. Here are the average temperatures.
Rieti - Average temperatures (1991-2020) |
| Month | Min | Max | Mean |
|---|
| January | 1.2 | 9.3 | 5.2 |
|---|
| February | 0.8 | 10.9 | 5.9 |
|---|
| March | 3.6 | 14.6 | 9.1 |
|---|
| April | 6.8 | 18 | 12.4 |
|---|
| May | 10.4 | 22.4 | 16.4 |
|---|
| June | 14.1 | 27.1 | 20.6 |
|---|
| July | 16 | 30.5 | 23.2 |
|---|
| August | 16.2 | 30.6 | 23.4 |
|---|
| September | 12.8 | 24.9 | 18.9 |
|---|
| October | 9 | 20 | 14.5 |
|---|
| November | 6.2 | 14.1 | 10.2 |
|---|
| December | 2.3 | 9.6 | 6 |
|---|
| Year | 8.3 | 19.4 | 13.8 |
|---|
amounts to
1145 millimeters per year: it is therefore quite abundant. It ranges from
35 millimeters in the driest month (July) to
170 millimeters in the wettest one (November). Here is the average precipitation.
Rieti - Average precipitation| Month | Days |
|---|
| January | 110 | 8 |
|---|
| February | 110 | 8 |
|---|
| March | 95 | 9 |
|---|
| April | 95 | 11 |
|---|
| May | 75 | 10 |
|---|
| June | 70 | 7 |
|---|
| July | 35 | 5 |
|---|
| August | 55 | 5 |
|---|
| September | 80 | 7 |
|---|
| October | 105 | 8 |
|---|
| November | 170 | 11 |
|---|
| December | 145 | 9 |
|---|
| Year | 1145 | 98 |
|---|
There are on average around 2400
sunshine hours per year. Here are the average hours of sunshine per day.
Rieti - Sunshine hours| Month | Average | Total |
|---|
| January | 4 | 125 |
|---|
| February | 4.5 | 125 |
|---|
| March | 5 | 160 |
|---|
| April | 6 | 185 |
|---|
| May | 8 | 250 |
|---|
| June | 9 | 270 |
|---|
| July | 10.5 | 330 |
|---|
| August | 9.5 | 300 |
|---|
| September | 8 | 235 |
|---|
| October | 6 | 190 |
|---|
| November | 4 | 125 |
|---|
| December | 3.5 | 110 |
|---|
| Year | 6.6 | 2400 |
|---|