Select units of measurement for the temperature and rainfall tables (metric or imperial).
Average weather, temperature, rainfall, sunshine hours

In Porto Torres, the climate is
Mediterranean, with mild, rainy winters and hot, sunny summers.
As in the rest of Sardinia, both the mistral (cool, dry wind from the north-west) and the sirocco (warm, humid wind from the south-east) can blow.
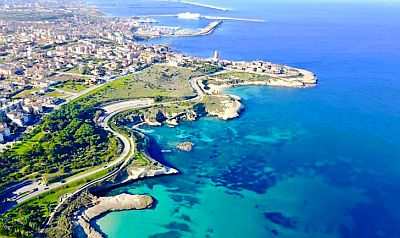
The town is located in the north-west of Sardinia, in the province of Sassari, on the coast of the Gulf of Asinara. The gulf is bordered to the north-west by the island of Asinara and by the smaller Isola Piana ("Flat Island").
In winter, the temperature rarely drops below freezing, although occasionally it can drop to -2 °C (28.5 °F). Occasionally, such as in February 2010 and February 2012, there may also be a snowfall with light accumulation.
In summer, when the sirocco blows, it can get very hot, and the temperature can reach 38/40 °C (100/104 °F). In July 2009 it reached 43 °C (109.5 °F).

Best Time
The best months for a
beach holiday are July and August. In June, the days are longer and the weather is often good, but the sea is still a bit cool. You can still go in September, in fact the sea is still quite warm, but the days get shorter and the first waves of bad weather can occur, especially in the second half of the month.
Porto Torres - Climate data
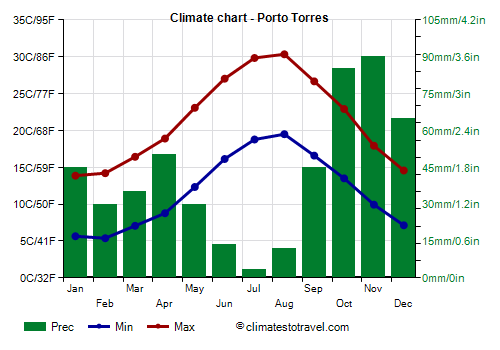
In Porto Torres, the
average temperature of the coldest month (January) is of
9.8 °C, that of the warmest month (August) is of
24.9 °C. Here are the average temperatures.
Porto Torres - Average temperatures (1991-2011) |
| Month | Min | Max | Mean |
|---|
| January | 5.7 | 13.9 | 9.8 |
|---|
| February | 5.4 | 14.2 | 9.8 |
|---|
| March | 7.1 | 16.4 | 11.8 |
|---|
| April | 8.8 | 18.9 | 13.8 |
|---|
| May | 12.3 | 23.1 | 17.7 |
|---|
| June | 16.1 | 27 | 21.6 |
|---|
| July | 18.8 | 29.8 | 24.3 |
|---|
| August | 19.5 | 30.3 | 24.9 |
|---|
| September | 16.6 | 26.7 | 21.6 |
|---|
| October | 13.5 | 22.9 | 18.2 |
|---|
| November | 9.9 | 17.9 | 13.9 |
|---|
| December | 7.1 | 14.6 | 10.9 |
|---|
| Year | 11.8 | 21.4 | 16.55 |
|---|
amounts to
500 millimeters per year: it is therefore quite scarce. It ranges from
3.4 millimeters in the driest month (July) to
90 millimeters in the wettest one (November). Here is the average precipitation.
Porto Torres - Average precipitation| Month | Days |
|---|
| January | 45 | 8 |
|---|
| February | 30 | 8 |
|---|
| March | 35 | 7 |
|---|
| April | 50 | 7 |
|---|
| May | 30 | 4 |
|---|
| June | 14 | 2 |
|---|
| July | 3 | 1 |
|---|
| August | 12 | 2 |
|---|
| September | 45 | 4 |
|---|
| October | 85 | 7 |
|---|
| November | 90 | 8 |
|---|
| December | 65 | 7 |
|---|
| Year | 500 | 65 |
|---|
The
sea temperature ranges from
14 °C in February, March to
25 °C in August. Here are the average sea temperatures.
Porto Torres - Sea temperature| Month |
|---|
| January | 14.5 |
|---|
| February | 14 |
|---|
| March | 14 |
|---|
| April | 15 |
|---|
| May | 17.5 |
|---|
| June | 21 |
|---|
| July | 24 |
|---|
| August | 25 |
|---|
| September | 23.5 |
|---|
| October | 21.5 |
|---|
| November | 18.5"> |
|---|
| December | 16 |
|---|
| Year | 18.8 |
|---|