Select units of measurement for the temperature and rainfall tables (metric or imperial).
Average weather, temperature, rainfall, sunshine hours

In Nuoro, the climate is
almost Mediterranean, with mild, rainy winters and hot, sunny summers.
As in the rest of Sardinia, both the mistral (cool, dry wind from the north-west) and the sirocco (warm, humid wind from the south-east) can blow.
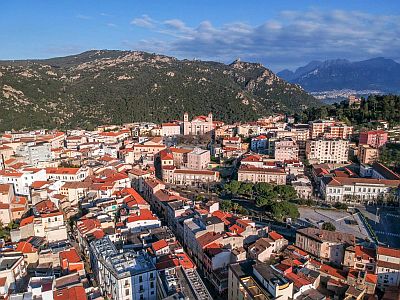
The city is located in the central-eastern part of Sardinia, at an altitude of 550 metres (1,800 feet).
Nearby is Mount
Ortobene, 955 meters (3,133 ft) high. To the south-east, we find the limestone massif of the
Supramonte, which reaches 1,463 meters (4,799 ft) in Mount Corrasi.
Winter, from December to February, is mild, and is characterized by sunny periods alternating with rainy periods.
Temperatures are a little lower than at sea level, and during cold air irruptions, the cold is felt more.
Snow in Nuoro is quite rare, however, it is more frequent than in the other provincial capitals of Sardinia, which are located in the plains or in any case at lower altitudes. On average, about 20 cm (8 in) of snow fall per year. In January 1999, the snow reached 40 cm (15.5 in) in height.
Typically, the temperature drops a few degrees below freezing during cold waves, however, in January 1999 it dropped to -10 °C (14 °F).

The
summer, from June to August, is hot and sunny, with some rare rain or thunderstorms. Nights are cooler than at sea level, and the humidity is lower, however, it can get very hot during the day.
In fact, in the hottest periods the temperature can reach 38/40 °C (100/104 °F). In July 2007 it reached 43.8 °C (110.8 °F).
Best Time
To visit Nuoro, you can choose the periods from mid-April to mid-June and from September to early October. In June, the weather is often nice, but it can sometimes get hot, especially in the second half of the month.
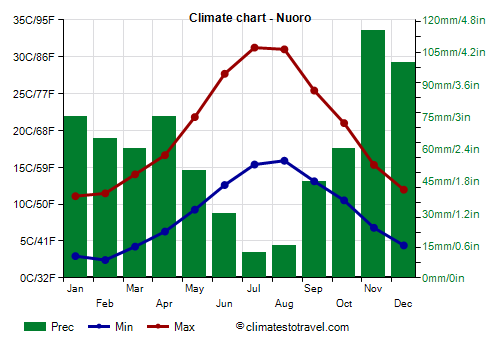
Nuoro - Climate data
In Nuoro, the
average temperature of the coldest month (February) is of
7 °C, that of the warmest month (August) is of
23.5 °C. Here are the average temperatures.
Nuoro - Average temperatures (1995-2020) |
| Month | Min | Max | Mean |
|---|
| January | 3 | 11.1 | 7 |
|---|
| February | 2.4 | 11.5 | 7 |
|---|
| March | 4.2 | 14 | 9.2 |
|---|
| April | 6.3 | 16.6 | 11.5 |
|---|
| May | 9.3 | 21.8 | 15.5 |
|---|
| June | 12.6 | 27.7 | 20.1 |
|---|
| July | 15.4 | 31.2 | 23.3 |
|---|
| August | 15.9 | 31 | 23.5 |
|---|
| September | 13.1 | 25.4 | 19.3 |
|---|
| October | 10.5 | 21 | 15.8 |
|---|
| November | 6.8 | 15.3 | 11.1 |
|---|
| December | 4.4 | 12 | 8.2 |
|---|
| Year | 8.7 | 19.9 | 14.3 |
|---|
amounts to
705 millimeters per year: so, it is at an intermediate level. It ranges from
12 millimeters in the driest month (July) to
115 millimeters in the wettest one (November). Here is the average precipitation.
Nuoro - Average precipitation| Month | Days |
|---|
| January | 75 | 9 |
|---|
| February | 65 | 10 |
|---|
| March | 60 | 9 |
|---|
| April | 75 | 11 |
|---|
| May | 50 | 7 |
|---|
| June | 30 | 4 |
|---|
| July | 12 | 2 |
|---|
| August | 15 | 2 |
|---|
| September | 45 | 6 |
|---|
| October | 60 | 9 |
|---|
| November | 115 | 11 |
|---|
| December | 100 | 8 |
|---|
| Year | 705 | 88 |
|---|