Select units of measurement for the temperature and rainfall tables (metric or imperial).
Average weather, temperature, rainfall, sunshine hours

The climate of Matera can be defined as
transitional Mediterranean, given that it has relatively mild winters and hot, sunny summers.
The city is located in southern Italy, in Basilicata, at an altitude of 400 meters (1,300 feet), in the western part of the
Murge, a karst plateau which is largely located in Puglia. The "sassi di Matera" are districts of the city that host rock-hewn buildings and architecture.
South-east of the city is the Parco della Murgia Materana, where there are rock-hewn churches built in the early Middle Ages. The Gravine di Matera are narrow canyon-shaped valleys formed by erosion.
To the west is the San Giuliano regional reserve, with the artificial lake created by a dam on the Bradano river.
The
winter, from December to February, is quite mild, however, it depends on the period.
There are mild periods, in which Atlantic currents prevail, during which there can also be rainy days.
During periods of stable weather, it can get cold at night, fog can form and the temperature can drop to the freezing point or slightly below.
On the other hand, during cold spells, the temperature can drop below freezing, and it can even snow.
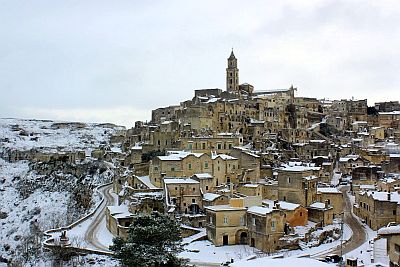
Snow in Matera is rarer than in Potenza, given the lower altitude, however it can occur when cold air from the Balkan Peninsula reaches the Murge after picking up moisture on the Adriatic Sea.

The
summer, from June to August, is hot and sunny, with rare rainy days and some thunderstorms coming from the Apennines.
During hot air invasions from Africa, the temperature can reach 36/37 °C (97/99 °F), and sometimes even 39/40 °C (102/104 °F).
Best Time
The
best times to visit Matera are spring and autumn, ie from mid-April to the end of May and from mid-September to mid-October. In summer it can get very hot, especially from late June to late August.
Matera - Climate data
In Matera, the
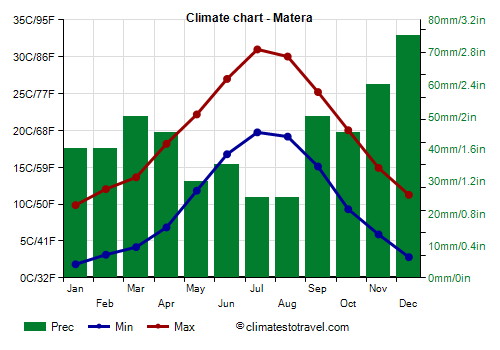
average temperature of the coldest month (January) is of
5.9 °C, that of the warmest month (July) is of
25.4 °C. Here are the average temperatures.
Matera - Average temperatures (2015-2020) |
| Month | Min | Max | Mean |
|---|
| January | 1.8 | 9.9 | 5.9 |
|---|
| February | 3.2 | 12 | 7.6 |
|---|
| March | 4.2 | 13.6 | 8.9 |
|---|
| April | 6.8 | 18.2 | 12.5 |
|---|
| May | 11.8 | 22.2 | 17 |
|---|
| June | 16.8 | 27 | 21.9 |
|---|
| July | 19.8 | 31 | 25.4 |
|---|
| August | 19.2 | 30 | 24.6 |
|---|
| September | 15.1 | 25.2 | 20.2 |
|---|
| October | 9.3 | 20 | 14.7 |
|---|
| November | 5.9 | 14.9 | 10.4 |
|---|
| December | 2.8 | 11.3 | 7 |
|---|
| Year | 9.8 | 19.7 | 14.7 |
|---|
amounts to
525 millimeters per year: so, it is at an intermediate level. It ranges from
25 millimeters in the driest months (July, August) to
75 millimeters in the wettest one (December). Here is the average precipitation.
Matera - Average precipitation| Month | Days |
|---|
| January | 40 | 6 |
|---|
| February | 40 | 4 |
|---|
| March | 50 | 6 |
|---|
| April | 45 | 7 |
|---|
| May | 30 | 4 |
|---|
| June | 35 | 5 |
|---|
| July | 25 | 3 |
|---|
| August | 25 | 2 |
|---|
| September | 50 | 5 |
|---|
| October | 45 | 5 |
|---|
| November | 60 | 7 |
|---|
| December | 75 | 9 |
|---|
| Year | 525 | 64 |
|---|
There are on average around 2645
sunshine hours per year. Here are the average hours of sunshine per day.
Matera - Sunshine hours| Month | Average | Total |
|---|
| January | 4.5 | 140 |
|---|
| February | 5 | 140 |
|---|
| March | 6 | 180 |
|---|
| April | 7 | 210 |
|---|
| May | 8.5 | 270 |
|---|
| June | 10 | 295 |
|---|
| July | 11 | 345 |
|---|
| August | 10.5 | 320 |
|---|
| September | 8.5 | 255 |
|---|
| October | 6.5 | 210 |
|---|
| November | 5 | 155 |
|---|
| December | 4 | 130 |
|---|
| Year | 7.3 | 2645 |
|---|