Select units of measurement for the temperature and rainfall tables (metric or imperial).
Average weather, temperature, rainfall, sunshine hours

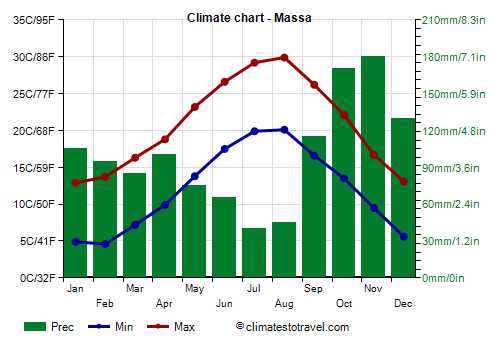
The climate of Massa is
Mediterranean, with mild, rainy winters and warm, sunny summers.
The
rains are abundant, in fact they amount to 1,200 millimeters (47 inches) per year. The rainiest period is from October to December.
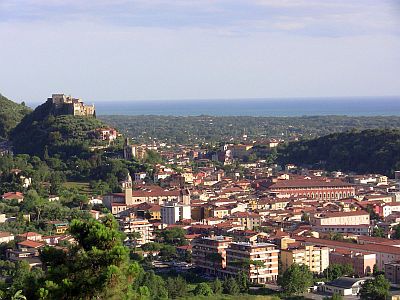
The city is the capital of the province of Massa-Carrara and is located in the north-west of Tuscany, a short distance from the coast of the Ligurian Sea. The city of Carrara is located 4 km (2.5 mi) to the northwest.
To the north are the
Apuane Alps, a mountain range that actually belongs to the Apennines and is famous for its marble quarries. To the north-west lies the Gulf of Sarzana.
The locality of Marina di Massa, now in fact part of the city, is considered the northernmost of
Versilia.
Winter, from December to February, is mild, with sunny periods but also periods of bad weather.
Snow in Massa is rare, however, during the most intense cold spells, snow can occasionally occur.
Typically, the temperature drops slightly below freezing on the coldest nights, however, in January 1985 it reached -7 °C (19.5 °F).
 Summer
, from June to August, is warm to hot and sunny.
Generally, the heat is not excessive because of the sea breeze, but we cannot exclude some particularly sultry periods, with highs of 32/33 °C (90/91 °F). In August 1981, the temperature reached 37 °C (98.5 °F).
Some weather disturbances may pass over the city even in summer, especially in June and in late August. Given the location between the mountains and the sea, violent thunderstorms can break out from time to time, perhaps accompanied by tornadoes.
Autumn is very rainy, and sometimes there can be floods.
Best Time
The
best times to visit Massa are spring and early summer, in particular, from mid-April to mid-June. September, too, is a good month, especially in the first half, while later, Atlantic depressions become more frequent.
In the height of summer, in July and August, it can be hot, although less frequently than in other parts of Italy.
For a beach holiday, the best months are exactly July and August.
Massa - Climate data
In Massa, the
average temperature of the coldest month (January) is of
8.9 °C, that of the warmest month (August) is of
25 °C. Here are the average temperatures.
Massa - Average temperatures (1991-2020) |
| Month | Min | Max | Mean |
|---|
| January | 4.9 | 12.9 | 8.9 |
|---|
| February | 4.6 | 13.7 | 9.1 |
|---|
| March | 7.2 | 16.3 | 11.8 |
|---|
| April | 9.9 | 18.8 | 14.4 |
|---|
| May | 13.8 | 23.2 | 18.5 |
|---|
| June | 17.5 | 26.6 | 22 |
|---|
| July | 19.9 | 29.2 | 24.5 |
|---|
| August | 20.1 | 29.9 | 25 |
|---|
| September | 16.6 | 26.2 | 21.4 |
|---|
| October | 13.5 | 22.1 | 17.8 |
|---|
| November | 9.5 | 16.7 | 13.1 |
|---|
| December | 5.6 | 13.1 | 9.4 |
|---|
| Year | 12 | 20.8 | 16.35 |
|---|
amounts to
1210 millimeters per year: it is therefore quite abundant. It ranges from
40 millimeters in the driest month (July) to
180 millimeters in the wettest one (November). Here is the average precipitation.
Massa - Average precipitation| Month | Days |
|---|
| January | 105 | 8 |
|---|
| February | 95 | 8 |
|---|
| March | 85 | 8 |
|---|
| April | 100 | 9 |
|---|
| May | 75 | 7 |
|---|
| June | 65 | 6 |
|---|
| July | 40 | 3 |
|---|
| August | 45 | 4 |
|---|
| September | 115 | 7 |
|---|
| October | 170 | 9 |
|---|
| November | 180 | 12 |
|---|
| December | 130 | 10 |
|---|
| Year | 1210 | 91 |
|---|
The
sea temperature ranges from
13 °C in February, March to
25 °C in August. Here are the average sea temperatures.
Massa - Sea temperature| Month |
|---|
| January | 13.5 |
|---|
| February | 13 |
|---|
| March | 13 |
|---|
| April | 14.5 |
|---|
| May | 18 |
|---|
| June | 21.5 |
|---|
| July | 24 |
|---|
| August | 25 |
|---|
| September | 22.5 |
|---|
| October | 20 |
|---|
| November | 17"> |
|---|
| December | 14.5 |
|---|
| Year | 18.1 |
|---|
There are on average around 2370
sunshine hours per year. Here are the average hours of sunshine per day.
Massa - Sunshine hours| Month | Average | Total |
|---|
| January | 4 | 120 |
|---|
| February | 5 | 135 |
|---|
| March | 5.5 | 165 |
|---|
| April | 6.5 | 200 |
|---|
| May | 8 | 240 |
|---|
| June | 9 | 265 |
|---|
| July | 10.5 | 320 |
|---|
| August | 9 | 285 |
|---|
| September | 7.5 | 225 |
|---|
| October | 6 | 180 |
|---|
| November | 4 | 115 |
|---|
| December | 3.5 | 110 |
|---|
| Year | 6.5 | 2370 |
|---|